If sales are going to fall off it will be after the layoffs and capital expenditure cuts from the fall in crude prices take place:
Jobless Claims
Highlights
Jobless claims data are low but still are still trending higher than a month ago in comparisons that do not point to further improvement for the monthly employment report. Initial claims did fall 3,000 in the December 6 week to 294,000 but the 4-week average, up slightly to 299,250, is still about 15,000 higher than in early November.
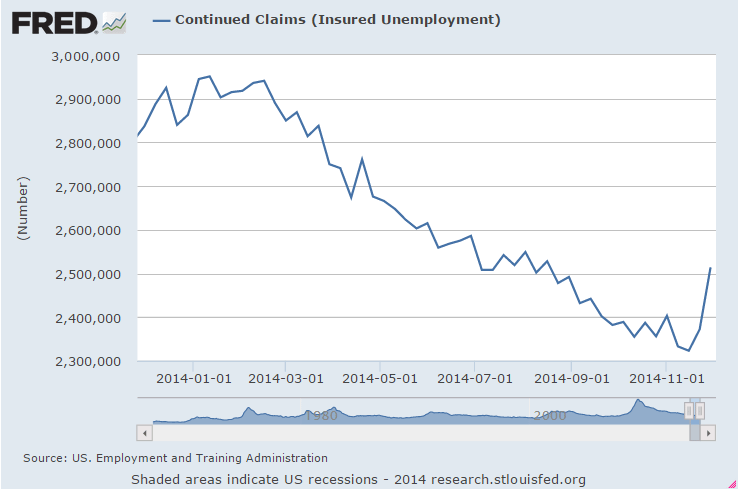
Continuing claims tell the same story, up a steep 142,000 to 2.514 million in lagging data for the November 29 week. This is the highest level since mid August. The 4-week average, up 28,000 to 2.386 million, is also up about 15,000 vs the month-ago comparison. The unemployment rate for insured workers ticked higher for the first time since late August, up 1 tenth to 1.9 percent.Retail Sales
Highlights
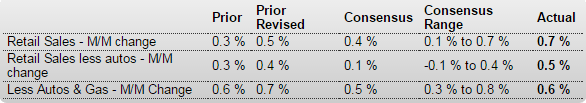
Retail sales in November came in strong despite lower gasoline prices. Retail sales in November posted a 0.7 percent boost after rebounding 0.5 percent in October Market expectations were for 0.4 percent rise for November. Autos jumped a notable 1.7 percent after gaining 0.8 percent in October. Excluding autos, sales increased 0.5 percent after rising 0.4 percent in October. Forecasts were for a 0.1 percent boost.
Gasoline station sales fell on lower prices. Sales declined 0.8 percent after a 1.3 percent drop in October. Excluding both autos and gasoline sales advanced 0.6 percent in November after a 0.7 percent rise the prior month. The median market forecast was for 0.5 percent.
Within the core strength was broad based, led by building materials & garden equipment (up 1.4 percent); clothing & accessories (up 1.2 percent); and nonstore retailers (up 1.0 percent).
Today’s retail sales report is favorable for fourth quarter GDP in the personal consumption component. Currently, the consumer sector is leading the recovery with confidence and spending up.
Import and Export Prices
Highlights
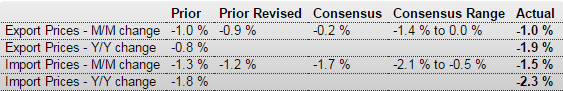
Cross-border price pressures are nowhere to be found in the import & export price report where import prices dropped 1.5 percent in November, the 5th straight drop and the steepest since June 2012, and export prices fell 1.0 percent for the 4th straight drop and matching the steepest drop since June 2012. The year-on-year rate for import prices is at minus 2.3, the steepest negative reading since April 2013, with export prices at minus 1.9, the steepest since October 2013.
And it’s not just oil-related prices that are falling. Excluding petroleum, import prices fell 0.3 percent in the month for a 4th straight drop and the steepest since April this year while export prices, excluding both food and fuels for this reading, fell 0.5 percent for a third straight drop. The year-on-year reading for ex-petroleum import prices is at only plus 0.1 percent with ex-food & ex-fuel export prices at minus 0.4 percent.
A look at finished goods shows extended declines for nearly all readings. Prices of imported motor vehicles are down 0.1 percent in the month for a 1.0 percent year-on-year decline while prices of exported consumer goods are down 0.3 percent for both the monthly and year-on-year comparisons.
The strong dollar is an important factor that is keeping import prices down, but it’s more than the dollar as evidenced by the export side of the data. Falling oil prices are having a spillover effect throughout the global price picture. Today’s data point to very soft readings for tomorrow’s producer price report and they won’t be lifting expectations for Wednesday’s consumer price report.Business Inventories
Highlights
Total business inventories rose slightly in October, up 0.2 percent, but show no significant change relative to business sales which slipped 0.1 percent. The stock-to-sales ratio is unchanged for a 3rd straight month at 1.30.