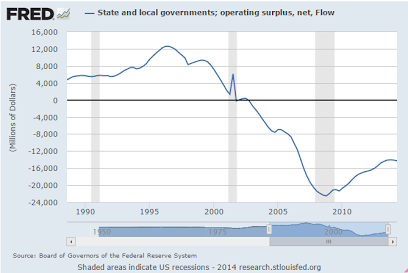
The bulk of the boost is coming from state and municipal governments. After tightening their budgets for three years following the end of the recession, they began stepping up spending in 2013 and continued to do so this year
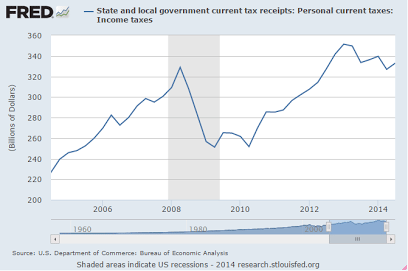
Except state taxes are growing faster, a headwind for the private sector.
But income taxes down- not sure why.
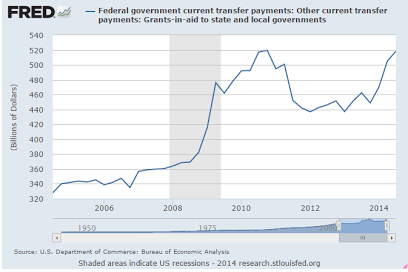
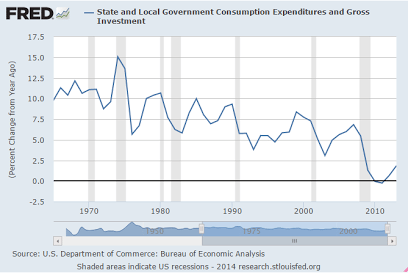
Not sure what this is about either:
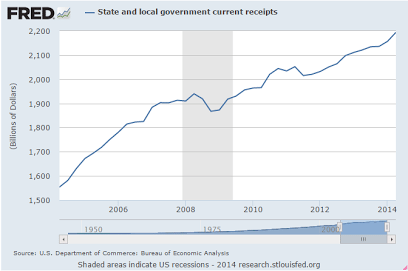
Total tax collections still rising:
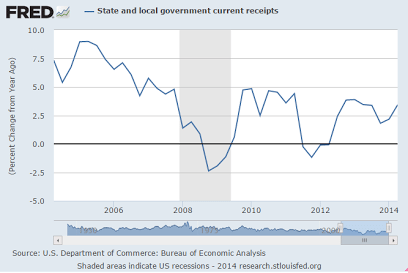
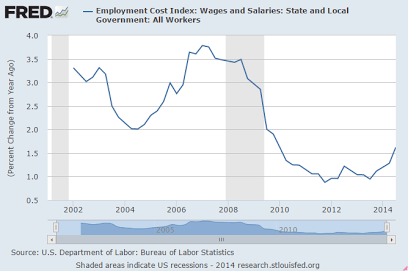
Up some but still historically low:
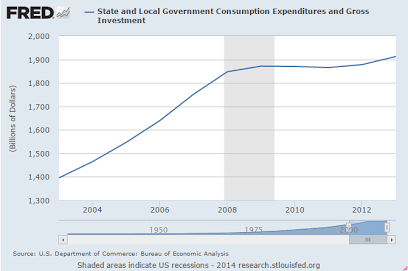
Very minor increases here:
Overall the states are still running deficits and are motivated eliminate them: