The Real Fiscal Responsibility Talk Show Pilot Project
This project is for everyone tired of hearing economic commentary from those who got everything wrong. For decades the the doctrine of “Fiscal Responsibility” interpreted as long-term deficit reduction and Government austerity has had a secure place in American politics. The three of us proposing this project believe that this doctrine is the economic equivalent of the medieval notion that patients must be bled to cure them of disease.
The notion that austerity is necessary after running budget deficits caused by economic downturns is false and damaging to economies all over the world. We have opposed targeted deficit reduction and austerity in the blogosphere and in an e-book since 2010. Yet despite our efforts and the efforts of many others who using the Modern Money Theory (MMT) approach to economics, as well as other post-Keynesians, the mythology of austerity still survives, waiting in the wings until the next debt ceiling or budgetary crisis provides an opportunity for austerity partisans to push their nostrums of spending cuts and “Grand Bargains” once again.
We value Real Fiscal Responsibility highly, but that doesn’t lie in targeted deficit reduction, or in spending cuts for their own sake. Instead, it lies in targeting real impacts, real benefits, and real results, and fulfilling the needs of real people. We want to replace the false and damaging austerian accountant’s green eyeshade paradigm of so-called Fiscal Responsibility, evaluated against the arbitrary standards and scare tactics of debt-to-GDP ratios and public debt levels, with the human scale paradigm of Real Fiscal Responsibility, evaluated against the standard of fulfilling public purpose.
We seek funding for a pilot project for a new radio/video series that will present, and advocate for this paradigm change. The project will create six shows that we will then use to get the series picked up by an existing cable network.
Please visit the donation page.
Daily Archives: August 20, 2014 @ 4:39 pm (Wednesday)
taking away the punch bowl
Architectural index up in July
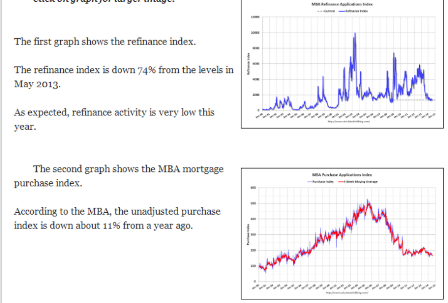
Mortgage purchase apps
Not good- purchase apps now down 11% vs last year.
And cash buyers have been fading as well.
And the size of homes built has leveled off.
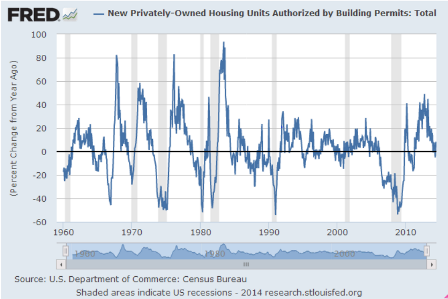
And check out what’s happened to the growth of new building permits.
Fortunately, as per the mainstream economists and analysts, bad news is good news, as it means the Fed will be lower for longer to a fault, triggering a credit led expansion…
:(
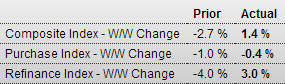
MBA Purchase Applications
A sizable drop in mortgage rates failed to give a lift to purchase applications which fell 0.4 percent in the August 15 week. The trend remains very weak with the year-on-year rate for the purchase index down 11 percent. Monday’s housing market report cited a rise in serious buyers for new homes, buyers however that are likely to be cash buyers based on mortgage application data.
Applications for conventional mortgages, both for purchases and refinancing, rose in the week but the report notes a 5.9 percent decline in applications for government mortgages that includes an unadjusted 8 percent decline in Department of Veterans Affairs applications. Federal Housing Administration and Rural Housing Service applications also fell.
Total refinancing applications rose 3.0 percent in the week giving a 1.4 percent lift to the composite index. Refinancing applications made up 55 percent of all applications vs 54 percent in the prior week. Rates moved lower with the average for conforming loans ($417,000 or lower) down 6 basis points to 4.29 percent.
Full size image
U.S. Home Size Levels Off, for Now at Least
Lawler: Table of Distressed Sales and Cash buyers for Selected Cities in July
By Bill McBride
Economist Tom Lawler sent me the table below of short sales, foreclosures and cash buyers for several selected cities in July.
Comments from CR: Tom Lawler has been sending me this table every month for several years. I think it is very useful for looking at the trend for distressed sales and cash buyers in these areas. I sincerely appreciate Tom sharing this data with us!
On distressed: Total “distressed” share is down in all of these markets, mostly because of a sharp decline in short sales.
Short sales are down in all of these areas.
Foreclosures are down in most of these areas too, although foreclosures are up a little in few areas like Nevada, Sacramento and the Mid-Atlantic.
The All Cash Share (last two columns) is mostly declining year-over-year. As investors pull back, the share of all cash buyers will probably continue to decline.