Empire State Mfg Survey
Highlights
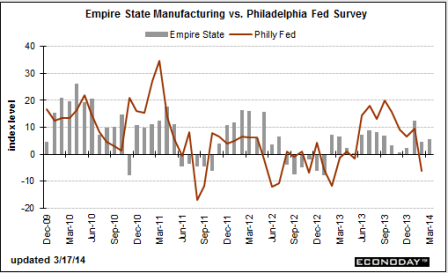
Steady but slow is the indication from the Empire State index which is up slightly this month, to 5.61 from 4.48 in February. New orders also show a slight increase, to 3.13 vs last month’s slightly contractionary reading of minus 0.21, as do shipments, at 3.97 vs 2.13. Growth in the sample’s employment reading slowed, to 5.88 from 11.25.
Other readings include a rise in inventories and a sizable draw in backlog orders. Price readings, despite this month’s rise in fuel costs, show easing pressure. Readings on the six-month outlook are a little less optimistic than prior months.
Full size image
This always seems to chug along at about 3% and doesn’t say much about anything else:
Industrial Production
Highlights
Capacity utilization Consensus Forecast for February 14: 78.6 percent
Range: 78.4 to 78.8 percent
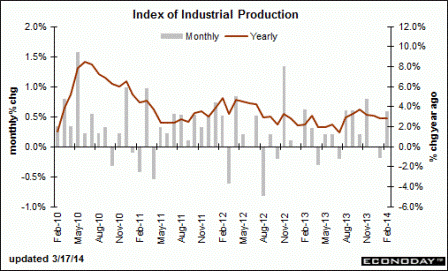
Industrial production was unexpectedly strong in February and utilities actually tugged down on the latest number. Industrial production rebounded 0.6 percent after dipping 0.2 percent in January. Market expectations were for a 0.3 percent gain.
By major components, manufacturing jumped 0.8 percent in February, following a 0.9 percent drop the month before. Mining rose 0.3 percent, following a 0.5 percent boost in January. Utilities slipped 0.2 percent after a 3.8 percent surge the prior month.
Full size image
So the challenge for 2014, at least so far, is to overcome drops in the growth of autos and housing vs 2013:
Housing Market Index
Highlights
The housing market index failed to bounce back much from February’s record loss, coming in at a lower-than-expected 47 for only a 1 point gain. Details for March once again show serious weakness in traffic, at 33 vs February’s 31. Weakness in traffic points to a lack of first-time buyers and underscores the continued importance of all cash buyers in the housing market.
Other details are on the plus side of 50 to indicate monthly growth but just barely, at 52 for current sales and 53 for future sales. The regional breakdown shows little separation except for the Northeast which lags badly but which however is by far the smallest region for new homes.
New home sales, which had been badly depressed, surged in January but this report points only to incremental growth for February and March. And the traffic component of this report points to a lack of sales growth in the months ahead. Watch for housing starts and permit data tomorrow morning on the Econoday calendar, both of which are expected to bounce back.


