More downward revisions on the way, with expectations of a reversal when the weather issues subside.
But with the federal deficit probably south of 3%, which seems to be struggling to keep pace with the demand leakages, the income lost due to the reduced growth of sales/output/employment means there is that much less support for any post weather rebound in spending/GDP.
“But freezing temperatures boosted demand for heating last month, causing utilities production to jump 4.1 percent.”
Industrial Production
Highlights
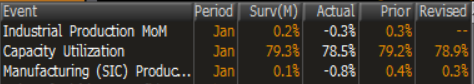
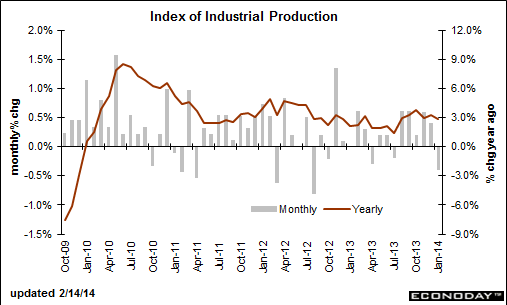
The manufacturing sector is losing traction-weather related or not. Overall industrial production fell 0.3 percent in January, following a 0.3 percent gain the month before. Analysts expected a 0.3 percent rise for the latest month.
Turning to major components, it was worse for manufacturing which dropped 0.8 percent after a 0.3 percent increase in December. The consensus projected a 0.1 percent increase for January. Atypically adverse weather helped the overall number from being weaker as utilities jumped 4.1 percent in January, following a 1.4 percent dip the prior month. Mining slipped 0.9 percent after gaining 1.8 percent.
Looking at detail for manufacturing, durables fell 0.8 percent in January, led down by a 5.0 percent drop in motor vehicles and parts. Nondurables declined 0.8 percent in January.
Manufacturing excluding motor vehicles decreased 0.5 percent in January, following a 0.3 percent rise in December.
Capacity utilization declined to 78.5 percent from 78.9 percent in December.
Today’s report adds to the argument that the first quarter will be sluggish. It also calls to attention as to whether the Fed will pause in its “measured steps” for tapering quantitative easing. But the Fed clearly will watch the next employment report before making that decision in mid-March.
The traditional non-NAICS numbers for industrial production may differ marginally from the NAICS basis figures.