
Employment continues to grow at the pace we’ve seen for the last couple of years at a pace that’s perhaps a bit ahead of population growth (chart).
The question is whether this is sufficient for the Fed to taper, which I’d say is anyone’s guess right now.
The FOMC clearly doesn’t like QE, but at the same time seems to me they will shy away from doing anything that might cause further increases in mortgage rates?
And for those who believe QE ‘works’ to sustain growth (or, as some believe, bring it back from the future), they have to be very concerned that with all the QE they’ve done this is all we have to show for it, wondering how bad it would have been without the QE, or what might happen if they back off.
October personal Income also was released at 8:30am and was weaker than expected, with the govt. shutdown likely a factor, so, as it’s been for a while, it’s a matter of waiting for cleaner data.
Inflation indicators continued weak as well, further complicating the tapering debate:
Personal Income and Outlays:
Highlights:
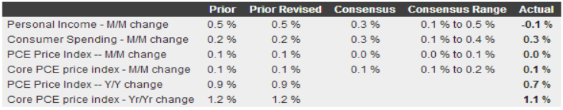
Overall consumer spending picked up a bit as expected at the beginning of the fourth quarter but not by much, to plus 0.3 percent in October vs plus 0.2 percent in September. Strength was in durable goods reflecting strong auto sales. Smaller gains were posted for nondurable goods and services.
The income side of the report is especially soft, at minus 0.1 percent following two very strong months at plus 0.5 percent. The decline is the first since January and may be related to the impact of the government shutdown on private wages. Wages & salaries are especially soft, up only 0.1 percent following gains of 0.4 and 0.6 percent in the two prior months.
Inflation readings are very soft with the price index unchanged and the core index up only 0.1 percent. The year-on-year rate for the price index is only plus 0.7 percent with the core year-on-year rate at plus 1.1 percent, both declining in the month and both well below the Fed’s goal of 2 percent.