Mosler Economics / Modern Monetary Theory
The Site of Economist Warren Mosler
Search
Main menu
Skip to primary content
Home
About
Mandatory Readings
MMT White Paper
Policy Proposals
Media
Q&A
Support
Contact
Post navigation
←
Previous
Next
→
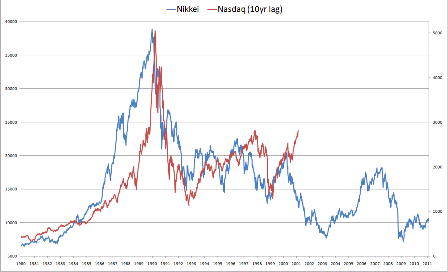
Nikkei/Nasdaq full graph
Posted on
February 15, 2011 @ 11:24 am (Tuesday)
by
WARREN MOSLER
Share