7DIF of Economic Policy (Mar 16)
[top]

(email exchange)
>
> On Thu, Mar 19, 2009 at 6:15 PM, Mauer wrote:
>
> Just to clarify: are there any circumstances in which the Federal Reserve
> could “create” inflation or hyperinflation a la the Bank of Zimbabwe?
>
Yes, if they raised rates high enough.
Seriously!
That would mean a large jump in government deficit spending on interest and a hike in the marginal cost of production. This is what happened after Volcker raised rates to over 20%. That inflation broke only because deregulation of natural gas in 1978 brought out enough supply to replace 15 million barrels per day of crude that was being burned for power, which broke the Saudi monopoly.
>
> Or does the unique privilege accorded to the central bank having the
> reserve currency always preclude that?
>
Just the way any non convertible currency works. Inflation isn’t all that much of a function of interest rates.
[top]
Yes, and when the proactive fiscal package kicks in next month adding to the already reasonably large deficit (from falling tax revenues and rising transfer payments) and starts driving up prices from liquidation levels, monetary policy will get the blame. Just like Greenspan’s getting blamed for the housing bubble that followed the 2003 fiscal adjustment and subsequent GDP growth.
Fed Balance Sheet Explodes
by Brian Wesbury and Robert Stein
Mar 18 (First Trust) — The Federal Reserve today went into overdrive in its attack on the US recession and financial system crisis.
We are definitely fearful of the long-term consequences of massively easy monetary policy, which today’s policy statement clearly signals. The US does not face a deflation problem, as February reports on producer and consumer prices revealed. As a result, easy money will become even more problematic than conventional wisdom believes or understands.
[top]
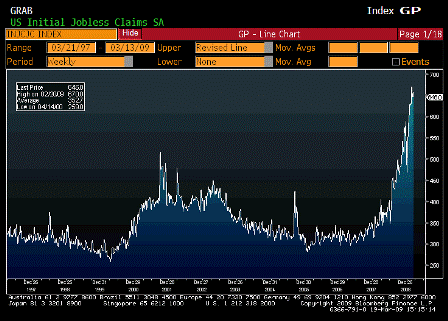
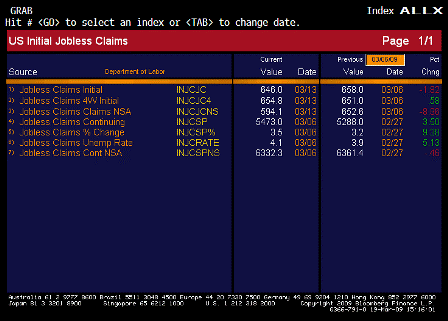
| Survey | 655K |
| Actual | 646K |
| Prior | 654K |
| Revised | 658K |
Karim writes:
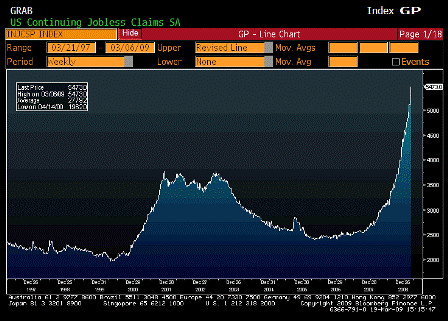
| Survey | 5323K |
| Actual | 5473K |
| Prior | 5317K |
| Revised | 5288K |
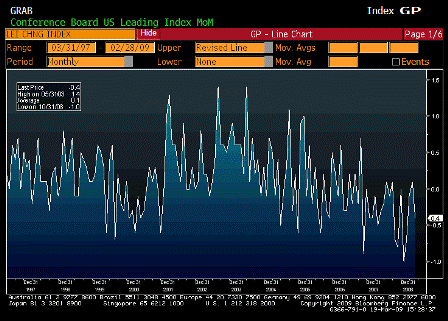
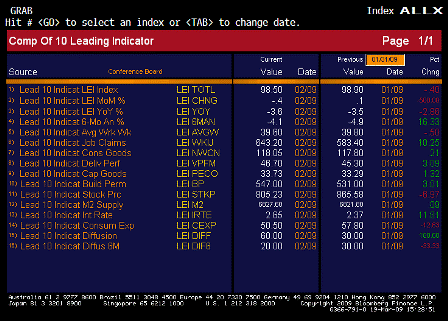
| Survey | -0.6% |
| Actual | -0.4% |
| Prior | 0.4% |
| Revised | 0.1% |
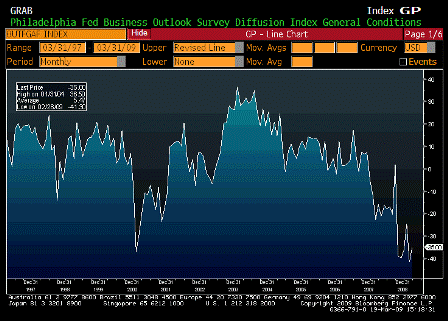
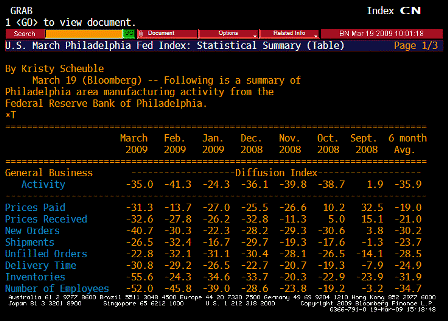
| Survey | -39.0 |
| Actual | -35.0 |
| Prior | -41.3 |
| Revised | n/a |
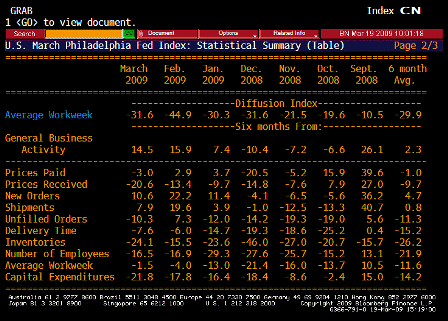
Karim writes:
[top]