Valance Chartbook update Mar 7, 2009- The Automatic Stabilizers are Quietly doing their Job
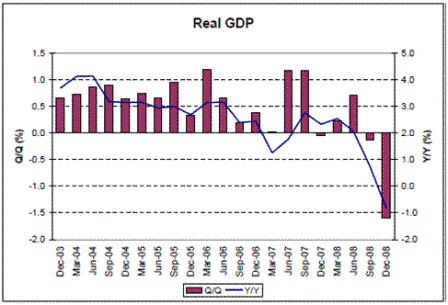
Q2 08 was the last up quarter (real growth up 2.8% annually), supported by the $170 billion fiscal adjustment.
Looks like all the last Congress had to do was keep doing a fiscal adjustment each quarter as needed to sustain positive output and employment growth.
Doesn’t seem like a lot to ask of them- spend more or cut taxes?
The subsequent declines could have easily been avoided.
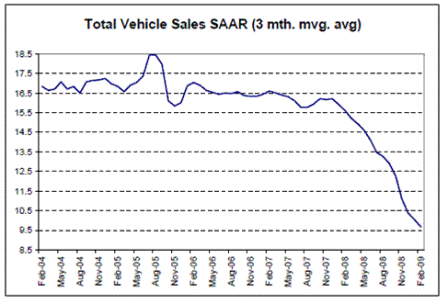
Interesting the auto execs didn’t blame Congress for the falling car sales and the financial crisis.
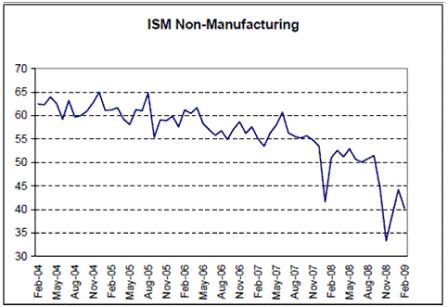
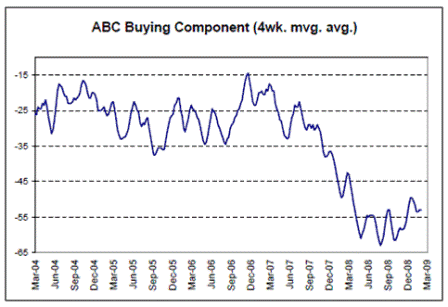
Almost all of the indicators look like this. Demand that had been slowly weakening for a long time fell apart sometime in July 2008.
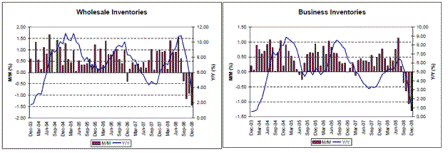
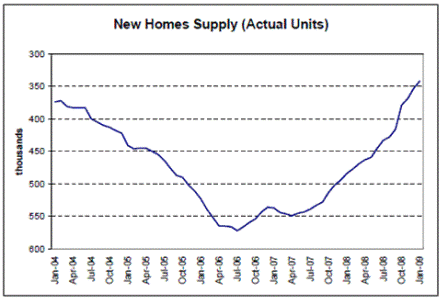
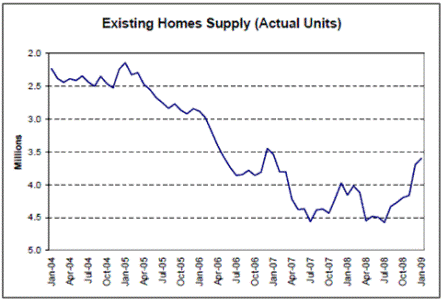
Like all recession’s I’ve seen, this one seems to have been characterized by inventory liquidation. Inventories now look to be very low.
The bulge in existing home sales was from the supply from foreclosures, which is also part of the inventory liquidation process.
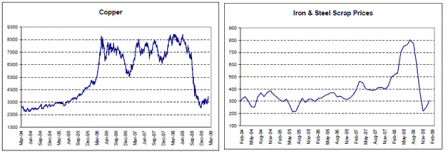
In addition to crude oil, the entire commodity basket was subject to the Great Mike Masters Inventory Liquidation. The charts seem to indicate that liquidation had run its course by late December 2008.
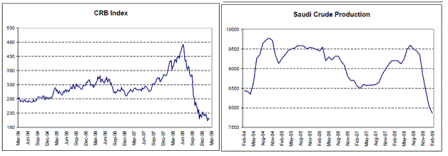
The Saudis and OPEC had to let the inventory liquidation run its course before regaining control of price late in Dec 08. Price is now going back to wherever they want it to be, as they set price to their liking and let output adjust. And with the latest data showing US gasoline consumption up 2% year over year it looks like demand for Saudi output may actually climb even as prices rise.
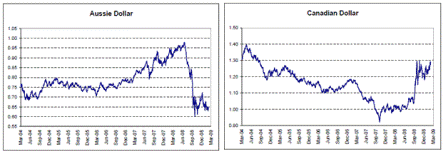
These commodity currencies have also gone sideways.
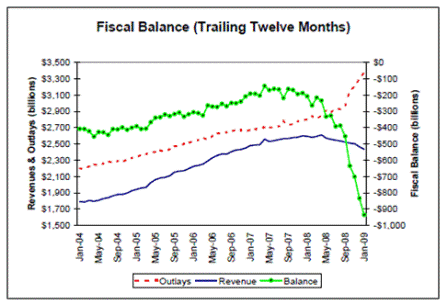
Coincident with the precipitous inventory liquidation and economic weakness, the automatic stabilizers kick in just as hard, increasing federal deficit spending via falling tax revenue and rising transfer payments.
This adds to private sector ‘savings’ of financial assets to the penny-
The accounting identity is government deficit = non-government ‘surplus’ of financial assets. (non-government includes residents and non-residents)
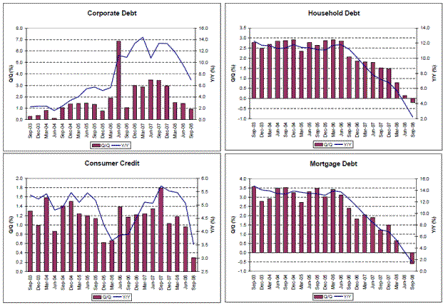
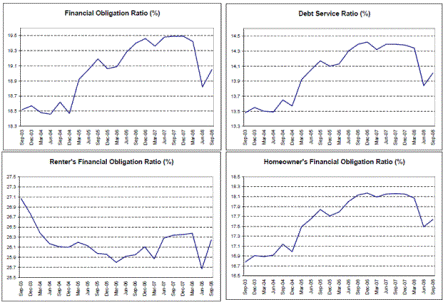
Less debt is mathematically the same as more savings.
Think of it this way. At the macro level, government deficit up= non-government net debt down.
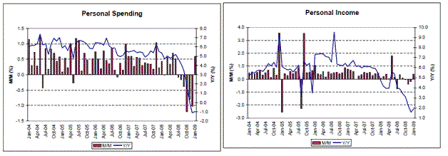
Meanwhile, the government deficit spending works to sustain personal income which works to support spending.
That’s how the automatic stabilizers work to keep recessions from turning into depressions.
There is some evidence beginning to surface, in addition to the above income and spending data, that maybe suggesting we are starting to move sideways rather than down.
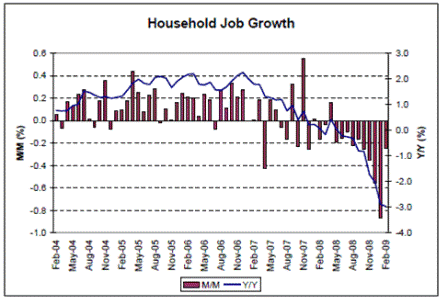
While unemployment will most likely continue to grow, as it takes at least maybe 2% real GDP growth for total hours worked to increase, there is some evidence at the margin that the rate of decline has peaked after a post year end spike from businesses that didn’t want to cut staff before the year-end holidays.
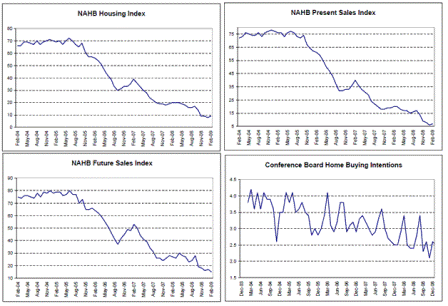
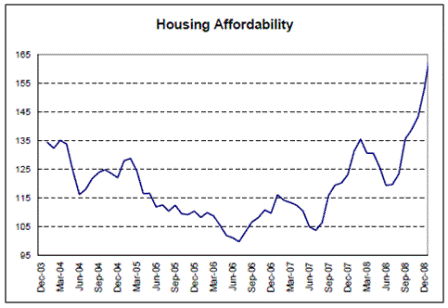
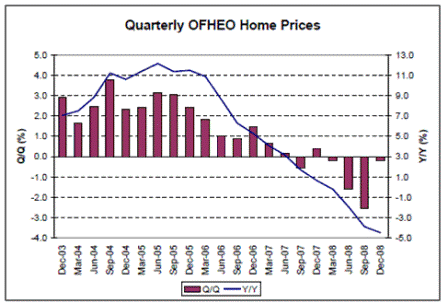
There is also some marginal evidence that the worst of the housing setback is behind us.
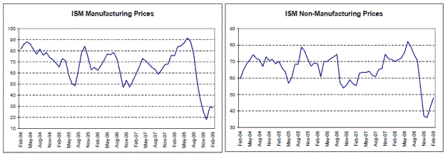
While the deflationary forces remain elevated by excess capacity in general, there is some evidence prices are selectively firming.
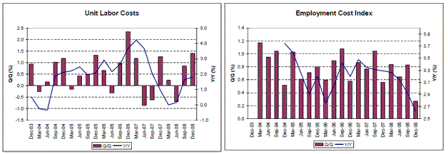
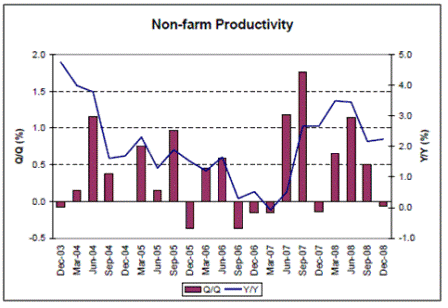
With low inventories prices get supported by replacement cost, which include costs of raw materials and unit labor costs, as well as productivity gains.
The new fiscal package isn’t my first choice, to be polite, but it isn’t ‘nothing’ either, and will further act to support demand and end this down cycle.
But it does nothing for near term energy consumption, and therefore risks rising commodity prices and rising CPI, even as unemployment remains unacceptably elevated.
This can put us back to where we started from- some growth but both weakness and inflation, this time with a backdrop of a much larger output gap, along with policy makers who don’t understand monetary operations and reserve accounting.
[top]
