- Producer Price Index MoM (Released 8:30 EST)
- PPI Ex Food and Energy MoM (Released 8:30 EST)
- Producer Price Index YoY (Released 8:30 EST)
- PPI Ex Food and Energy YoY (Released 8:30 EST)
- Initial Jobless Claims (Released 8:30 EST)
- Continuing Claims (Released 8:30 EST)
- Jobless Claims ALLX (Released 8:30 EST)
- Empire State Manufacturing Survey (Released 8:30 EST)
- Empire State Manufacturing Survey ALLX 1 (Released 8:30 EST)
- Empire State Manufacturing Survey ALLX 2 (Released 8:30 EST)
- Philadelphia Fed (Released 10:00 EST)
- Philadelphia Fed TABLE 1 (Released 10:00 EST)
- Philadelphia Fed TABLE 2 (Released 10:00 EST)
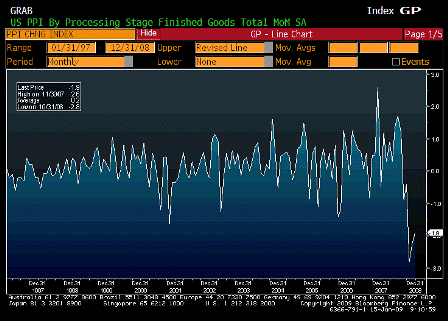
Producer Price Index MoM (Dec)
| Survey | -2.0% |
| Actual | -1.9% |
| Prior | -2.2% |
| Revised | n/a |
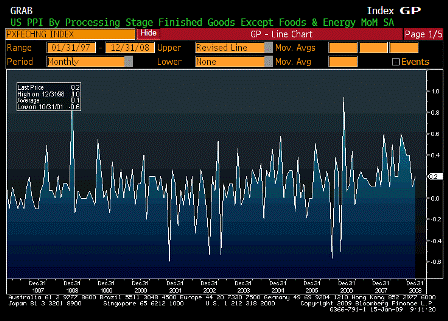
PPI Ex Food and Energy MoM (Dec)
| Survey | 0.1% |
| Actual | 0.2% |
| Prior | 0.1% |
| Revised | n/a |
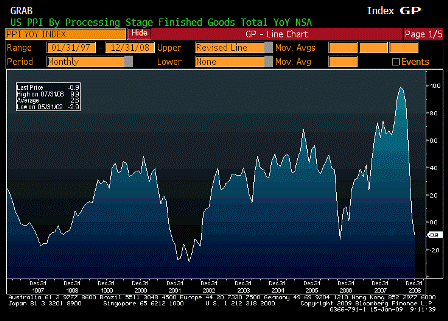
Producer Price Index YoY (Dec)
| Survey | -1.1% |
| Actual | -0.9% |
| Prior | -0.4% |
| Revised | n/a |
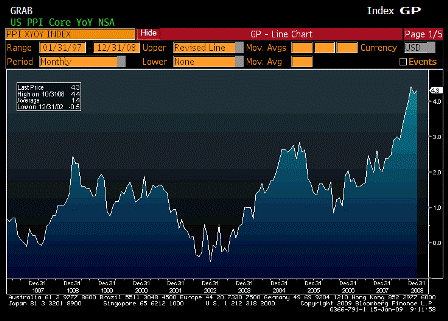
PPI Ex Food and Energy YoY (Dec)
| Survey | 4.1% |
| Actual | 4.3% |
| Prior | 4.2% |
| Revised | n/a |
Karim writes:
- PPI -1.9% m/m and now -0.9% y/y; core +0.2%; consumer goods category -2.6% m/m
- Pipeline pressures continue to plunge: core intermediate goods -3% m/m and core crude -2.2%
- Lots of Asian indicators suggesting price pressures will continue to plummet, especially in manufacturing
- Japan machine tool orders – 72% y/y
- Taiwan exports -42% y/y
- Korean GDP -16% annualized in Q4!
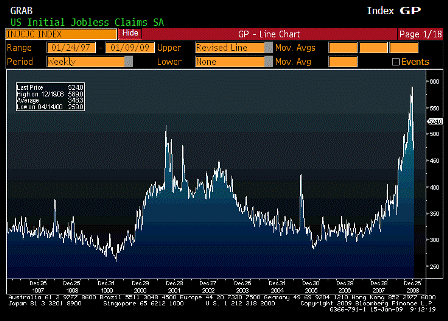
Initial Jobless Claims (Jan 10)
| Survey | 503K |
| Actual | 524K |
| Prior | 467K |
| Revised | 470K |
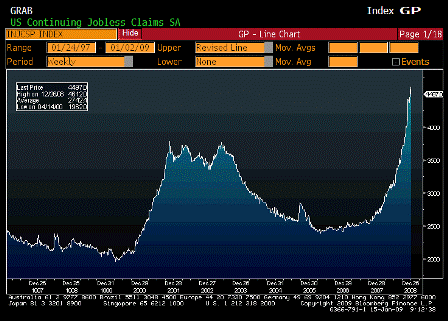
Continuing Claims (Jan 3)
| Survey | 4620K |
| Actual | 4497K |
| Prior | 4611K |
| Revised | 4612K |
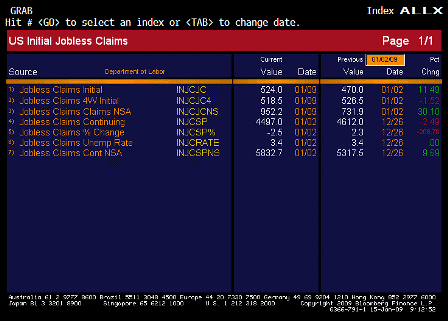
Jobless Claims ALLX (Jan 10)
Karim writes:
- Initial claims up 54k to 524k as number reverts back to pre-holiday levels
- Continuing claims drop 115k to 4497k; as duration of unemployment lengthens, this number may become more volatile as individuals exhaust their claims (unless benefits are extended, which might happen)
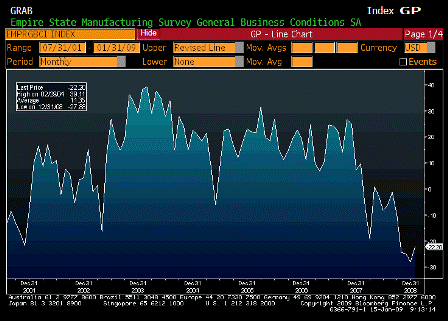
Empire State Manufacturing Survey (Jan)
| Survey | -25.00 |
| Actual | -22.20 |
| Prior | -25.76 |
| Revised | -27.88 |
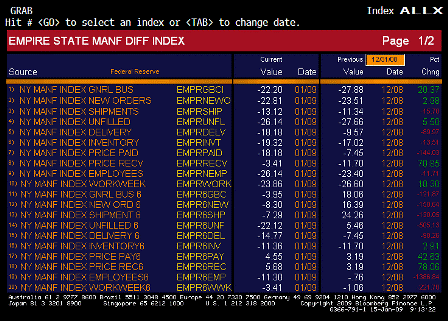
Empire State Manufacturing Survey ALLX 1 (Jan)
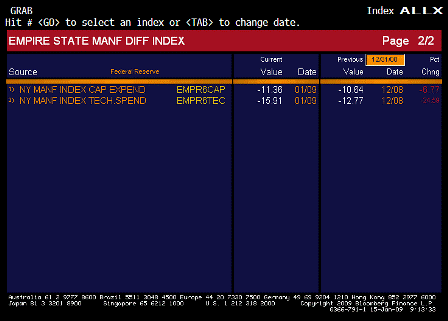
Empire State Manufacturing Survey ALLX 2 (Jan)
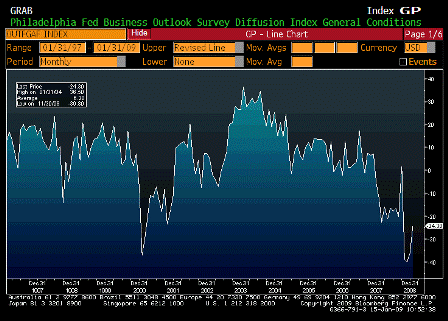
Philadelphia Fed (Jan)
| Survey | -35.0 |
| Actual | -24.3 |
| Prior | -32.9 |
| Revised | -36.1 |
Karim writes:
- Philly Fed improves from -36.1 to -24.3, but remains well into contraction territory
- Employment component falls from -28.6 to -39.1
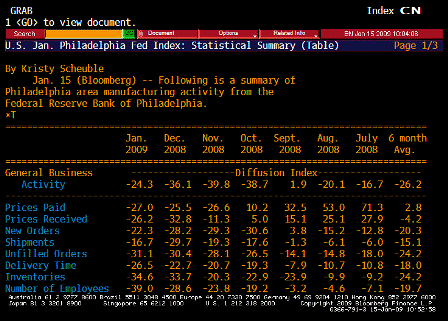
Philadelphia Fed TABLE 1 (Jan)
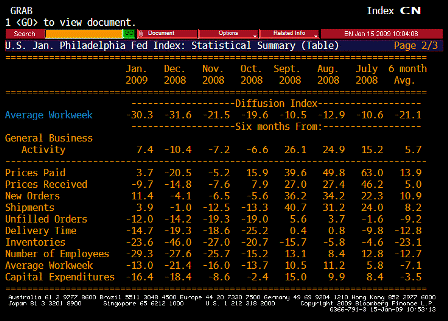
Philadelphia Fed TABLE 2 (Jan)
[top]


