- Durable Goods Orders MoM (Released 8:30 EST)
- Durable Goods Orders YoY (Released 8:30 EST)
- Durables Ex Transportation MoM (Released 8:30 EST)
- Durables Ex Defense MoM (Released 8:30 EST)
- Durable Goods ALLX (Released 8:30 EST)
- Initial Jobless Claims (Released 8:30 EST)
- Continuing Jobless Claims (Released 8:30 EST)
- Jobless Claims ALLX (Released 8:30 EST)
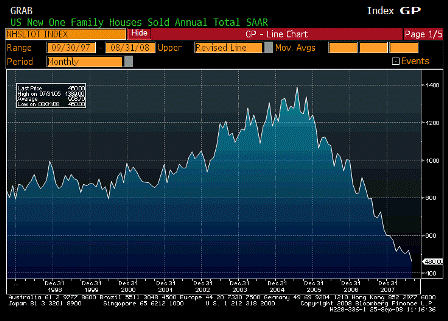
- New Home Sales (Released 10:00 EST)
- New Home Sales- Total For Sale (Released 10:00 EST)
- New Home Sales MoM (Released 10:00 EST)
- New Home Sales YoY (Released 10:00 EST)
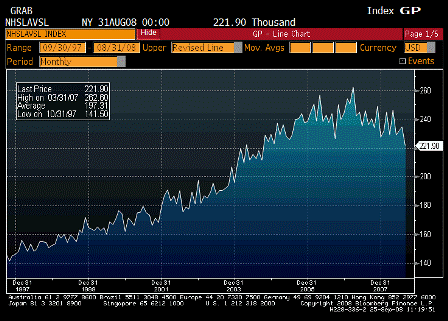
- New Home Sales Median Price (Released 10:00 EST)
- New Home Sales TABLE 1 (Released 10:00 EST)
- New Home Sales TABLE 2 (Released 10:00 EST)
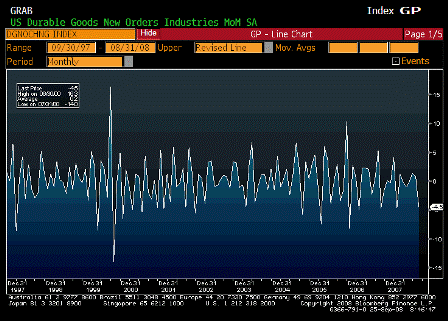
Durable Goods Orders MoM (Aug)
| Survey | -1.9% |
| Actual | -4.5% |
| Prior | 1.3% |
| Revised | 0.8% |
A very volatile series
Way lower than expected, and prior revised down as well.
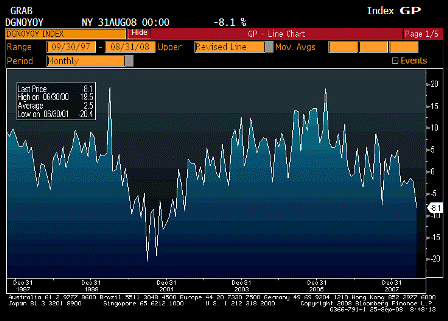
Durable Goods Orders YoY (Aug)
| Survey | n/a |
| Actual | -8.1% |
| Prior | -2.2% |
| Revised | n/a |
Continuing its downward drift that started about a year ago.
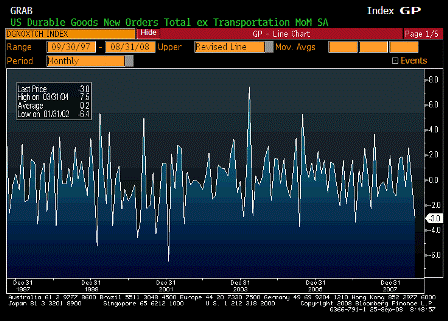
Durables Ex Transportation MoM (Aug)
| Survey | -0.5% |
| Actual | -3.0% |
| Prior | 0.7% |
| Revised | 0.1% |
It wasn’t all transportation. This is also lower than expected, and the prior month revised lower.
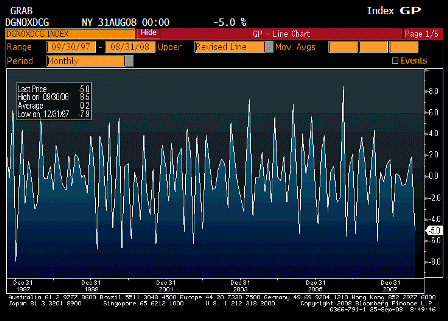
Durables Ex Defense MoM (Aug)
| Survey | n/a |
| Actual | -5.0% |
| Prior | 1.9% |
| Revised | n/a |
The jump in defense kept the total from being even worse.
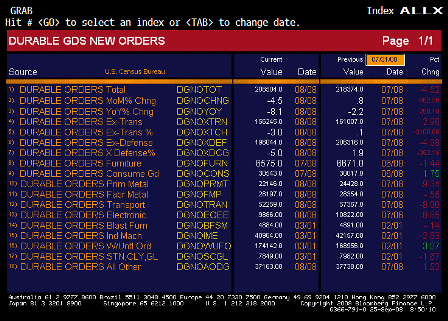
Durable Goods ALLX (Aug)
Consumer goods and defense, the only bright (modest) spots.
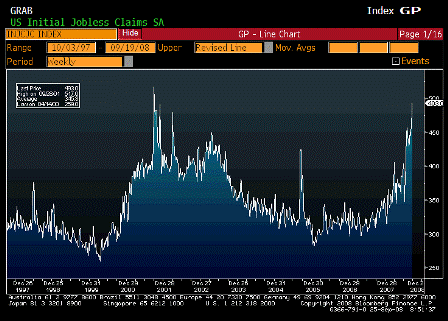
Initial Jobless Claims (Sep 20)
| Survey | 450K |
| Actual | 493K |
| Prior | 455K |
| Revised | 461K |
A large spike up. Government estimated 50,000 due to the hurricanes; so, it would have been 430,000. This will take a few weeks to sort out.
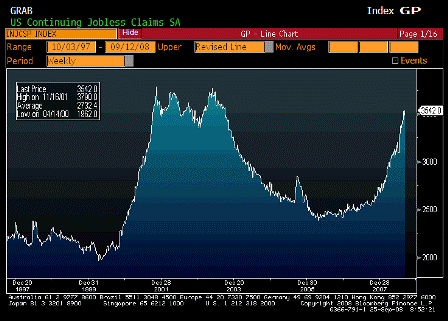
Continuing Jobless Claims (Sep 13)
| Survey | 3510K |
| Actual | 3542K |
| Prior | 3478K |
| Revised | 3479K |
This just keeps going up towards recession levels. No telling how much extended benefits has added, both now and in the last recession.
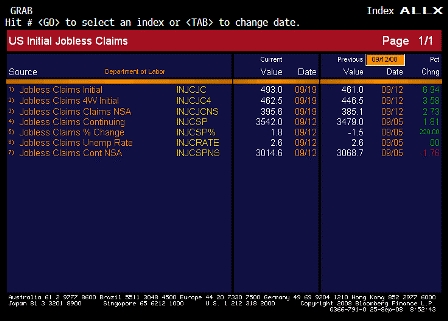
Jobless Claims ALLX (Sep 20)
New Home Sales (Aug)
| Survey | 510K |
| Actual | 460K |
| Prior | 515K |
| Revised | 520K |
Lower than expected, and last month revised up as suspected. They’ve been revising previous months up for a while.
There may be a problem with availability of desirable homes, as starts are down by 1 million per year, and inventories are down as well.
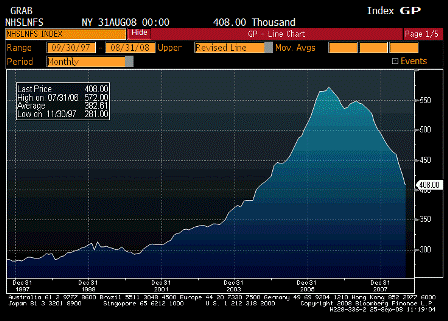
New Home Sales- Total For Sale (Aug)
| Survey | n/a |
| Actual | 408.00 |
| Prior | 427.00 |
| Revised | n/a |
This continues to fall rapidly and should lead to a shortage in the next few months.
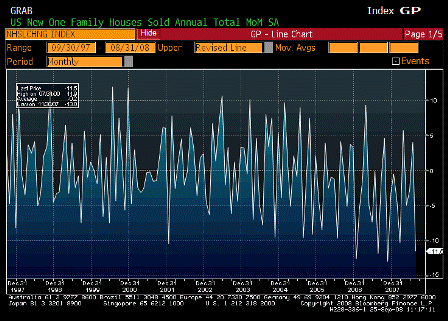
New Home Sales MoM (Aug)
| Survey | -1.0% |
| Actual | -11.5% |
| Prior | 2.4% |
| Revised | 4.0% |
Lower than expected and prior month revised up.
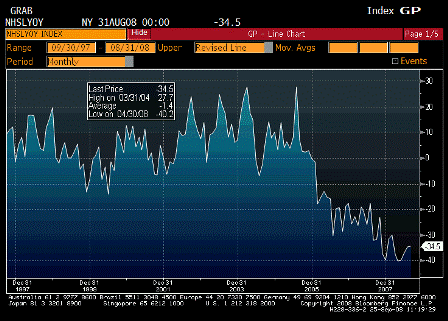
New Home Sales YoY (Aug)
| Survey | n/a |
| Actual | -34.5% |
| Prior | -34.7% |
| Revised | n/a |
Down a lot but signs of bottoming.
New Home Sales Median Price (Aug)
| Survey | n/a |
| Actual | 221.90K |
| Prior | 234.90K |
| Revised | n/a |
Still drifting lower but so far not collapsing.
New Home Sales TABLE 1 (Aug)
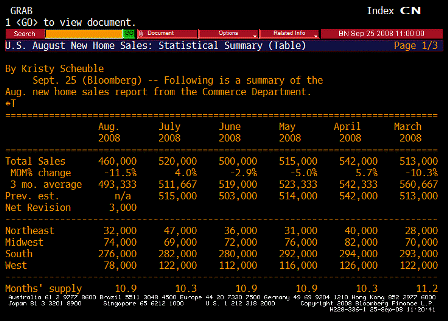
Something happened in the west.
New Home Sales TABLE 2 (Aug)
Karim writes:
- Quite weak data that is leading to downward revisions to Q3 and Q4 GDP estimates. Q3 revisions about -½% that I have seen, some GDP estimates now coming in below 1%.
- The shipments data is more highly correlated to current quarter growth.
- -3.5% m/m headline, -2.1% ex-transport, -3.6% ex-defense.
- Orders data more problematic for Q4.
- -4.5% m/m headline, -3% ex-transport, -5% ex-defense.
- Fairly broad-based weakness across sectors as well.
- Capex had been holding up fairly well this year, but now looks as if retrenching; with private consumption likely to be weak and Bernanke signaling an export slowdown, not too many pillars of support left for the economy. Look for more fiscal stimulus and rate cuts.
[top]


