2008-08-11 Weekly Credit Graph Packet


[Skip to the end]


IG On-the-run Spreads (Aug 11)

[top][end]

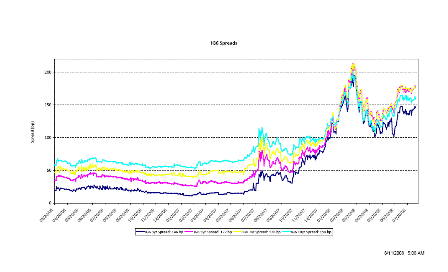
IG6 Spreads (Aug 11)

[top][end]

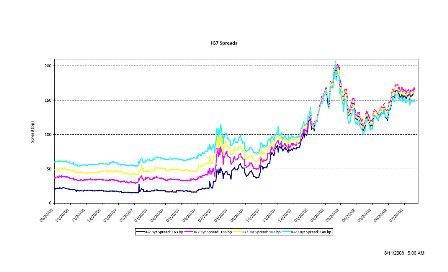
IG7 Spreads (Aug 11)

[top][end]

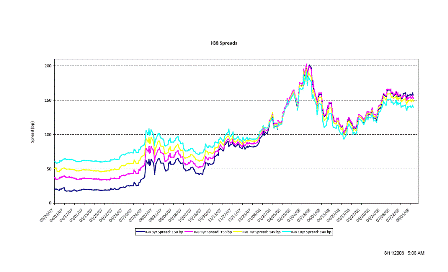
IG8 Spreads (Aug 11)

[top][end]

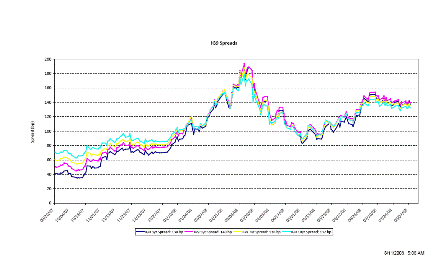
IG9 Spreads (Aug 11)


[top]

NYPost: Lost Sovereignity – There’s a new land grab


[Skip to the end]

Hope they don’t dig it up and take it home!

Lost Sovereignity

Oil-rich Fund Eyeing Foreclosed US Homes


By Teri Buhl

There’s a new land grab starting in America.

Foreign money, which up to now has focused its attention on investing in iconic commercial real estate – like Barneys New York and the Chrysler Building – is now moving to scoop up tens of thousands of discounted foreclosed homes across the country.

One sovereign fund, said to have earmarked $29 billion to purchase foreclosed residential real estate, recently hired a West Coast mortgage broker and is starting to search for bargains, The Post has learned.

The search, which is being carried out, in part, by Field Check Group mortgage consultant Mark Hanson, who was retained by the broker, Steve Iversen, is concentrating on single- and multi-family REO (real estate owned) homes, or homes that have already been taken over by the mortgagee.

Neither Iversen nor Hanson would disclose the name of the client, but sources told The Post it’s a sovereign fund.

The unidentified fund joins individual US investors, hedge funds and Wall Street banks in kicking the tires of REO homes, which have fallen in value so much that they are now tempting investments.

A sovereign fund would have two distinct advantages over other investors – the depressed value of the US dollar makes the homes a bargain, and sovereign funds have deeper pockets.

The sovereign fund of Abu Dhabi, for example, has a reported $875 billion in assets, while Norway has $391 billion, Singapore has $303 billion and Kuwait has $264 billion in their sovereign funds, which are funded by proceeds from oil sales.

The Abu Dhabi Investment Authority is expected to announce next month what type of US distressed assets they will be investing in and real estate is at the top of the list, according to a report in Financial Times last week.

ADIA did not respond to an e-mail question about REO investments.

So far, prices on bulk sales of REO properties vary based on location and are selling from 60 cents to 80 cents on the dollar. Hanson started out offering 40 cents on the dollar for about $2.5 billion worth of California properties owned by IndyMac and Washington Mutual but was turned down. The banks refused to comment.

Hanson is now willing to pay 50 cents to 60 cents on the dollar for a collection of California REOs worth at least $500 million.

In fact, this week Hanson’s team negotiated a $2 billion package mixed with homes across the country for 31 cents on the dollar. While progress seems slow, Hanson reminds us this is only a nine-month old industry.

Some market experts think such deeply discounted REOs, like the deal Hanson just closed, are more fiction than fact.

“The size and discount of that type of deal isn’t the norm yet,” said Robert Pardes, with Recourse Recovery Management Services, a provider of mortgage advisory services.

“The critical mass of bulk REO is in well-capitalized institutions that don’t need to sell yet in bulk at a deep discount because they are better off not taking substantial hits to the capital just to get the assets off their books,”

This may change, should the market become more crowded with bank failures and distressed institutions, he said.

Enoch Lawrence, senior vice president of CB Richard Ellis, says “This type of bulk buy would make an impact on the market. They are in a unique position because they have a long time horizon to invest and a cheap cost of capital. It’s actually a perfect time for them to acquire these REO assets.”


[top]

Crude and the USD


[Skip to the end]

My current assessment is that the crude sell-off has caused the USD’s strength.

Lower crude prices make the USD ‘harder to get’ as oil producers get fewer USD for the same volume of crude (and product) exports to the US.

Likewise, this also brings down the US trade gap which is about half directly related to oil prices, so nonresidents have fewer USD to meet their USD financial asset savings desires.

Crude has been brought down by technical selling, which also brought with it technical buying of USD as trend following trading positions were unwound.

The crude market has gone into contango as would be expected with a futures sell off and tight inventories.

Tighter US credit conditions made the USD ‘harder to get’ while increased deficit spending makes the USD ‘easier to get’ resulting in GDP muddling through at modest rates of growth.

The Russian invasion probably helped the USD today.

Eurozone credit quality erosion with the onset of intensified economic weakness may be triggering an exit from the euro. The lowest risk euro financial assets are the national governments which carry similar risk to US States, and are vulnerable in a slowdown that forces increasing national budget deficits that are already in what looks like ‘ponzi’ for credit sensitive agents.

Eurozone bank deposit insurance is not credible and therefore the payment system itself vulnerable to an economic slowdown.

With the Russian army on the move, public and private portfolios may not want to hold the debt of the eurozone national governments that they accumulated when diversifying reserves from the USD.

I expect the Saudis to resume hiking crude prices once the selling wave has passed. I don’t think there has been an increase in net supply sufficient to dislodge them from acting as swing producer. And I also expect them to continue to spend their elevated revenues on real goods and services to keep the west muddling through at positive but sub-trend growth.

And the Russian invasion will linger on and help support the USD as a safe haven in the near-term

[top][end]


Comments about this post from email:

MIKE:

Again, its very likely you have permanently damaged demand at prices that are still over 100-

It’s possible the growth of crude consumption has slowed, but I still think it’s doubtful if consumption had declined enough to dislodge Saudi price control. July numbers still not out yet.

in addition asset alligators around the world are actually or synthetically short the dollar after 8 years of dollar selling…

Agreed. The question is the balance of the technicals, and if the CBs no longer buying USD has been absorbed by others.

For now, yes, short covering has mopped up the extra USD sloshing around from our trade gap, but it’s still maybe $50 billion per month that has to get placed. Not impossible for non-government entities to take it but it’s a tall order.

The Russian invasion helps a lot as well. That could be a much more important force than markets realize. Looks like a move to further control world energy supplies. A middle-eastern nation could be on the bear’s menu. I doubt the US could do anything about a Russian takeover of another neighbor. Certainly not go to war with Russia. and they know it.


[top]
2008-08-08 EU News Highlights

Looks like a demand leakage if it goes through:

Highlights:

German Net Pay May Shrink on Social Insurance Changes, FAZ Says


Article snip:

German Net Pay May Shrink on Social Insurance Changes, FAZ Says (Bloomberg) – Germany’s top wage earners may take home less pay next year because a larger portion of their wage may be subjected to social insurance contributions, the Frankfurter Allgemeine Zeitung said on its Internet site. A pension insurance panel has suggested in its regular annual review to raise the amount of gross monthly pay on which contributions have to be paid by 100 euros ($152) to 5,400 euros in western Germany and by 50 euros to 4,550 euros in the eastern half of the country, the newspaper said. Employees whose pay is above these thresholds will pay an extra 11.60 euros per month into pension and unemployment insurance coffers from the start of next year, the newspaper said. The panel’s proposals are generally approved, it said. Thresholds for health and nursing insurance contributions will also be raised, the FAZ said, without providing figures.

2008-08-08 US Economic Releases


[Skip to the end]


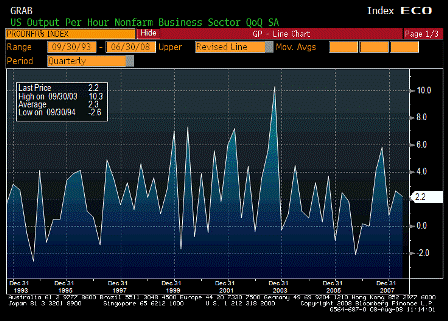
Nonfarm Productivity QoQ (2Q P)

Survey 2.5%
Actual 2.2%
Prior 2.6%
Revised n/a

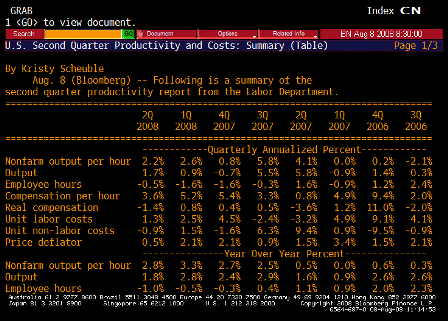
GDP gains are coming from productivity as hours worked decline.

[top][end]

Nonfarm Productivity TABLE 1 (2Q P)

[top][end]

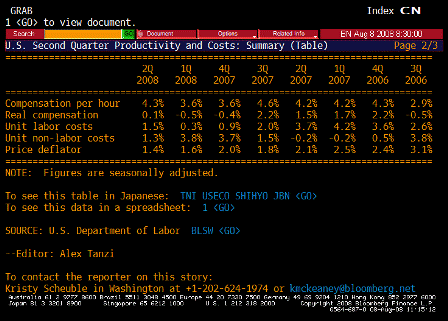
Nonfarm Productivity TABLE 2 (2Q P)

[top][end]


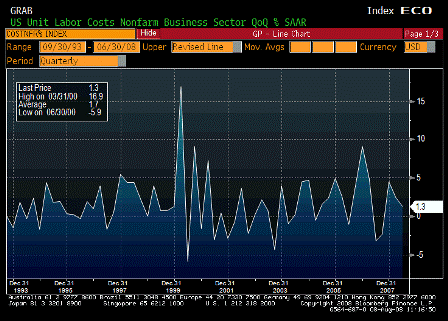
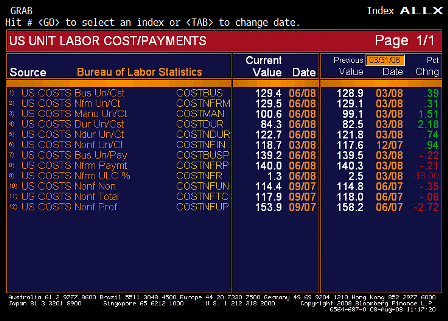
Unit Labor Costs QoQ (2Q P)

Survey 1.4%
Actual 1.3%
Prior 2.2%
Revised 2.5%

Better than expected due to productivity increases.

If the USD stays strong, it could help import prices moderate as well.

[top][end]

Unit Labor Costs ALLX (2Q P)

Karim writes:

Productivity based on hours, not employment; so we should see productivity in q2 of about 3.5% vs gdp of 1.9%.

Right, makes sense. More output from fewer workers and fewer hours is keeping GDP positive (and that much demand, which includes demand for exports, is supporting prices) even as labor markets soften.

Same as in prior 2 qtrs as hours were cut more aggressively than employment>Q4 gdp was -0.2% and productivity was +0.9%: Q1 GDP of 0.9% and productivity of 2.4%

[top][end]


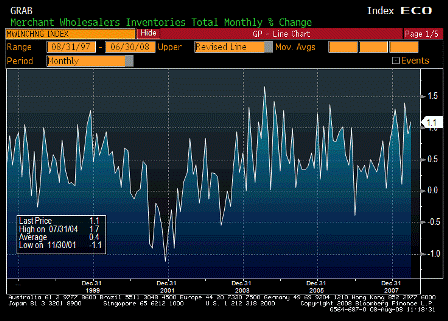
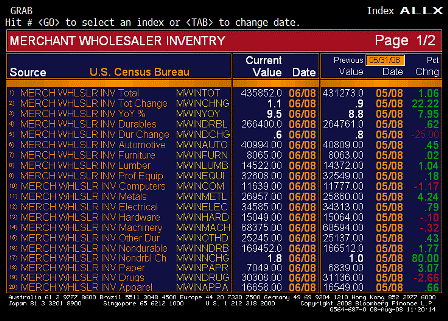
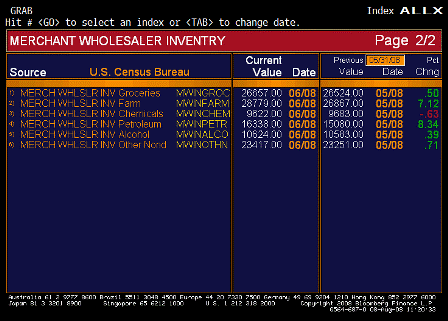
Wholesale Inventories MoM (Jun)

Survey 0.6%
Actual 1.1%
Prior 0.8%
Revised 0.9%

Higher than expected. Might mean upward Q2 GDP revision.

[top][end]

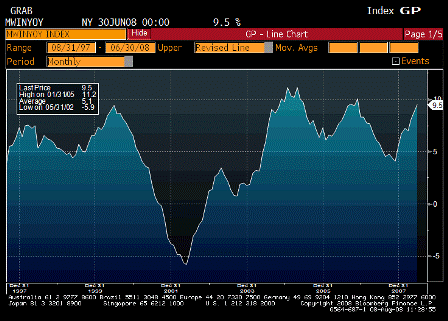
Wholesale Inventories YoY (Jun)

Survey n/a
Actual 9.5%
Prior 8.8%
Revised n/a

With all the talk of weakness, increased inventories are most likely due to increased order flow.

[top][end]

Wholesale Inventories ALLX 1 (Jun)

[top][end]

Wholesale Inventories ALLX 2 (Jun)


[top]

Bloomberg: Fed can’t reduce LIBOR

I could fix this in twenty minutes…

Money Market `Plagued’ by Libor That Fed Can’t Reduce

by Gavin Finch

(Bloomberg) A year after central banks started to pump trillions of dollars into the financial system to end a seizure in credit markets caused by subprime mortgages, cash is about as tight as it’s ever been.

The U.S. market for commercial paper, or short-term IOUs, backed by assets such as mortgages has shrunk 40 percent from its peak in July 2007. The amount borrowed in pounds between banks in the U.K. fell by 70 percent in June from a record in February 2007. The European Central Bank received $100 billion of bids for the $25 billion it offered to financial institutions on July 29, the most since the sales began in December.

Efforts by the Federal Reserve, ECB and Swiss National Bank to shore up the world’s biggest banks and promote lending have had limited success.

Re: Crude oil pricing


[Skip to the end]

(an email exchange)

>   
>   On Thu, Aug 7, 2008 at 7:15 AM, Scott wrote:
>   
>   crude moves further in backwardation.
>   

Right, indicating futures buying subsiding and inventories not above desired levels for commerce.

>   
>   CL vs brent now 160 over vs 120 under 2 weeks ago!
>   

Also indicating any excess inventory is gone, thanks!

Might be near the end of the second Master’s sell off.


[top]

2008-08-07 US Economic Releases


[Skip to the end]


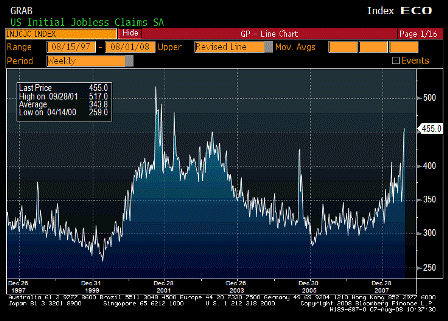
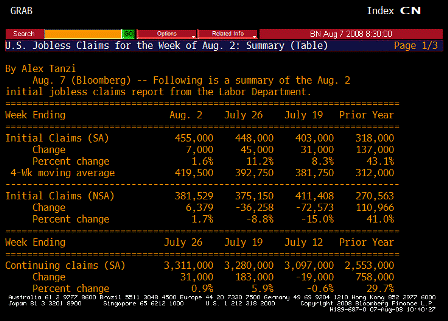
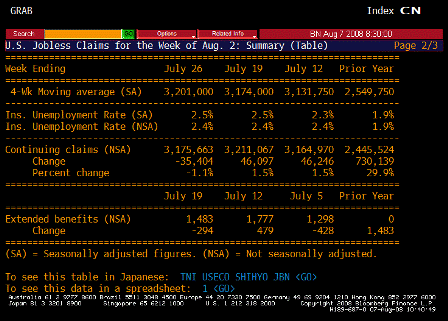
Initial Jobless Claims (Aug 2)

Survey 425K
Actual 455K
Prior 448K
Revised n/a

Karim writes:

  • Initial claims rise 7k to new cycle high of 455k with 4wk moving avg up from 393k to 420k

[top][end]

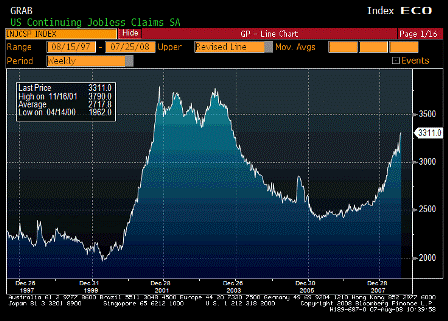
Continuing Jobless Claims (Jul 26)

Survey 3255K
Actual 3311K
Prior 3282K
Revised 3280K

Karim writes:

  • Continuing claims rise from 3280k to 3311k and 4wk moving avg up from 3174k to 3201k

[top][end]

Jobless Claims TABLE 1 (Jul 26)

[top][end]

Jobless Claims TABLE 2 (Jul 26)

Cesar writes:

A year ago we were at 4.7% unemployment rate (7,137 unemployed/ 153,182 labor force)

We are currently at 5.7% unemployment rate (8,784 unemployed/ 154,603 labor force)

Seems nearly the entire jump in unemployment is due to labor force increases.

Total employed is about flat.

In that case, GDP growth is about equal to productivity growth.

Karim writes:

  • Initial claims somewhat distorted by new program to extend benefits where those filing extensions are considered first time filers (double counted); this should have an effect for the first 2-3 weeks of the program before initial claims fall back to trend level (same happened back in 2001). Last week was first week of program, so numbers for next 2 weeks should reflect underlying trend (last number before extension program was 403k). Of concern would be if numbers don’t fall back much.
  • This program does not effect continuing claims, which reflects ability to find a job once laid off. This is at a new cycle high.

[top][end]


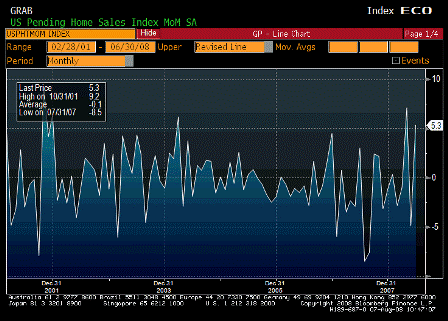
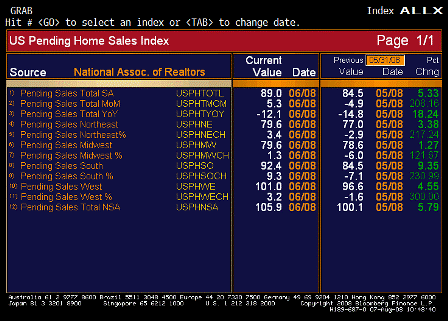
Pending Home Sales MoM (Jun)

Survey -1.0%
Actual 5.3%
Prior -4.7%
Revised -4.9%

Karim writes:

  • Rise 5.3% m/m, continuing recent see-saw pattern (-4.9%, +7.1% prior 2mths).

Q2 GDP for Japan and Germany are out next week. A German newspaper yesterday leaked German GDP growth likely to be -1 to -1.5%. Much of this is a giveback for a strong Q1 of +1.5% but definitely weaker than expected. Of concern to the ECB is that Spain (industrial production now down 10% y/y) and Italy already written off, so much depends on Germany. Moreover, German PMIs have gotten off to a very weak start for Q3. I imagine that was at the root of Trichet’s more dovish tone today.

Estimates for Japanese Q2 GDP are in the -1% to -3.5% range. The July Tankan and the foreign orders component of last night’s machinery orders data also don’t bode too well for Q3.

[top][end]

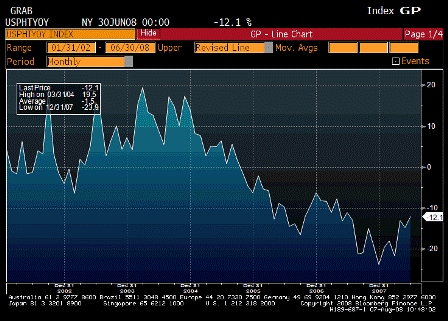
Pending Home Sales YoY (Jun)

Survey n/a
Actual -12.1%
Prior -14.8%
Revised n/a

Looks like it has bottomed and moving up as prices have adjusted and GDP has improved.

Housing my no longer be subtracting from GDP.

[top][end]

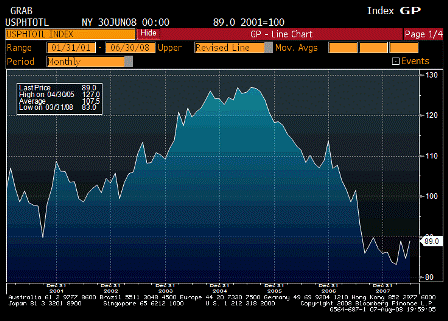
Pending Home Sales Total SA (Jun)

Survey n/a
Actual 89.0
Prior 84.5
Revised n/a

Looks to have found support and probably bottomed albeit at very low levels.

[top][end]

Pending Home Sales ALLX (Jun)

[top][end]


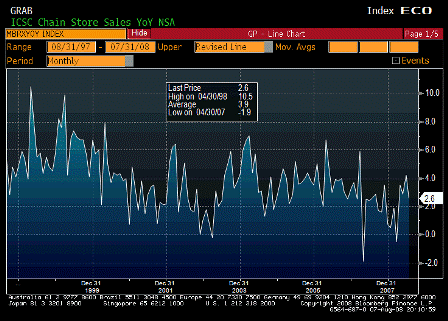
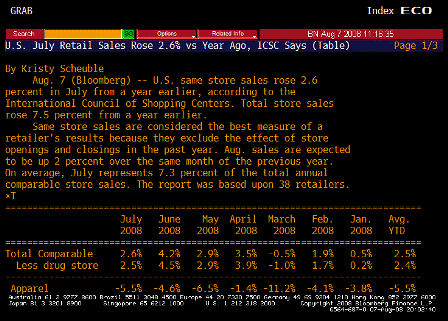
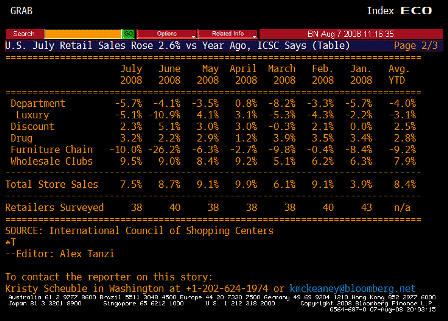
ICSC Chain Store Sales YoY (Jul)

Survey 3.4%
Actual 2.6%
Prior 4.3%
Revised 4.2%

Less then expected but not bad.

[top][end]

ICSC TABLE 1 (Jul)

[top][end]

ICSC TABLE 2 (Jul)

[top][end]


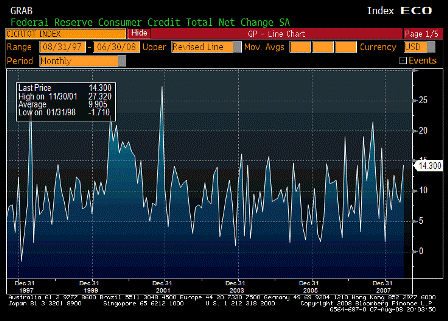
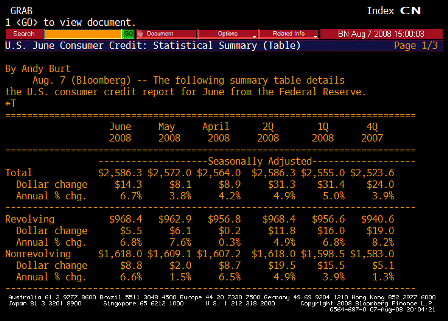
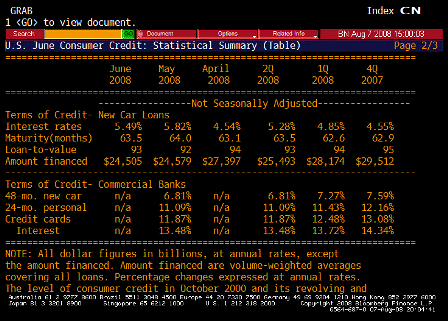
Consumer Credit (Jun)

Survey $6.3B
Actual $14.3B
Prior $7.8B
Revised $8.1B

Volatile series. Moving up some to support higher levels of spending.

[top][end]

Consumer Credit TABLE 1 (Jun)

[top][end]

Consumer Credit TABLE 2 (Jun)

Note from the graph the improving position of the domestic sector as the government deficit and net exports rise and support domestic ‘savings’ and spending. The US budget deficit is expected to exceed 3% this year and exports should remain firm even with slowing foreign economies. In fact, that’s one of the primary reasons those economies are slowing.

U.S. June Consumer Credit Up $14.3 Billion, More Than Forecast

by Shobhana Chandra

(Bloomberg) U.S. consumers borrowed more than twice as much as economists forecast in June as the slump in real-estate prices prevented American homeowners from tapping into home-equity lines of credit.

Consumer credit rose by $14.3 billion, the most since November, to $2.59 trillion, the Federal Reserve said today in Washington. In May, credit rose by $8.1 billion, previously reported as an increase of $7.8 billion. The Fed’s report doesn’t cover borrowing secured by real estate.

Consumers are using credit cards and loans to cover expenses as falling home values cause banks to restrict access to home- equity lines. The Bush administration sent out tax rebate checks in the past three months to help support spending, which accounts for more than two-thirds of the economy.

“Consumers are stressed, and some who are short of cash are relying more on credit cards,” Joseph Brusuelas, chief economist at Merk Investments LLC in Palo Alto, California, said before the report.


[top]

2008-08-07 UK News Highlights


[Skip to the end]

Highlights:

ECB Leaves Interest Rates at Seven-Year High to Fight Inflation
German industrial orders drop
Western European Car Sales Fall by 6.7% in July, JD Power Says
German June Exports Rise the Most in Nearly Two Years
German Economy Contracted as Much as 1.5% in 2Q
French Trade Deficit Expands to Record as Euro Curbs Exports
Italian June Production Stalls as Record Oil Prices Damp Growth
Fall in output fuels Spanish recession fears


Article snip:

ECB Leaves Interest Rates at Seven-Year High to Fight Inflation (Bloomberg) – The ECBkept interest rates at a seven-year high to fight inflation even as evidence of an economic slump mounts. ECB policy makers meeting in Frankfurt left the benchmark lending rate at 4.25 %, as predicted by all 60 economists in a Bloomberg News survey. The bank, which raised rates last month, will wait until the second quarter of next year to cut borrowing costs, a separate survey shows. The ECB is concerned that the fastest inflation in 16 years will help unions push through demands for higher wages and prompt companies to lift prices. At the same time, record energy costs and the stronger euro are strangling growth. Economic confidence dropped the most since the Sept. 11 terrorist attacks in July and Europe’s manufacturing and service industries contracted for a second month. ECB President Jean-Claude Trichet will hold a press conference 2:30 p.m. to explain today’s decision.

Same as UK, less costly to address inflation now rather than support growth and address inflation later if it gets worse.

It’s been said in the US that the Fed needs to firm up the economy first, and then address inflation. To most Central Bankers this makes no sense, as they use weakness to bring inflation down.

In their view that means the Fed wants to get the economy strong enough to then weaken it.

The Fed majority sees it differently.

They agree with the above.

However, for the last year they have been forecasting lower inflation and lower growth were willing to take the chance that supporting growth would not result in higher inflation.

Now, a year later, the FOMC is faced with higher inflation and more growth than the UK and Eurozone, and systemic ‘market functioning’ risk remains.

The FOMC continues to give the latter priority as they struggle with fundamental liquidity issues that stem from a continuing lack of understanding of monetary operations.


[top]