2008-08-14 US Economic Releases


[Skip to the end]


Consumer Price Index MoM (Jul)

Survey 0.4%
Actual 0.8%
Prior 1.1%
Revised n/a

Out of control, but if the recent commodity sell off holds headline will moderate some for awhile. Lots of pass-throughs and cost push forces in place.

[top][end]

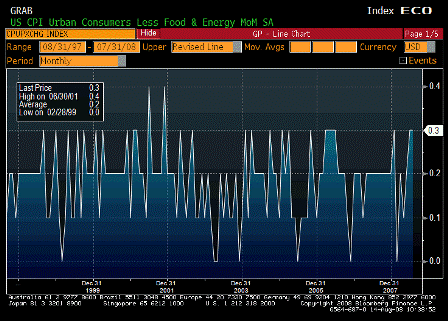
CPI Ex Food & Energy MoM (Jul)

Survey 0.2%
Actual 0.3%
Prior 0.3%
Revised n/a

[top][end]

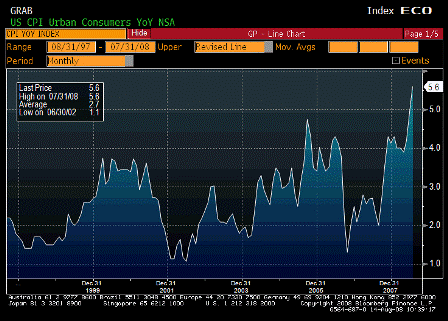
Consumer Price Index YoY (Jul)

Survey 5.1%
Actual 5.6%
Prior 5.0%
Revised n/a

The Fed has to be concerned that the 2% FF rate is way too accommodative, especially with Q2 GDP no forecast at over 3% and Q3 looking like 2%.

[top][end]

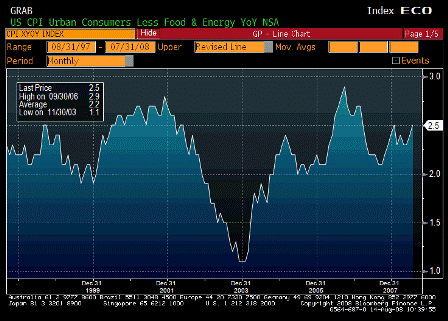
CPI Ex Food & Energy YoY (Jul)

Survey 2.4%
Actual 2.5%
Prior 2.4%
Revised n/a

Could be headed much higher as cost push pass-throughs starting to register.

[top][end]

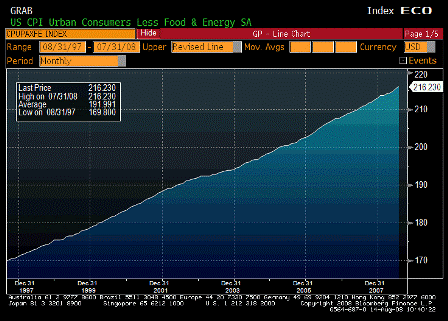
CPI Core Index SA (Jul)

Survey n/a
Actual 216.230
Prior 215.526
Revised n/a

[top][end]

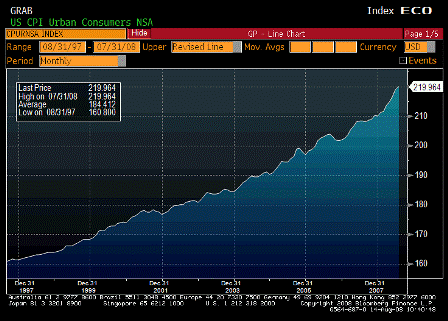
Consumer Price Index NSA (Jul)

Survey 219.075
Actual 219.964
Prior 218.815
Revised n/a

[top][end]

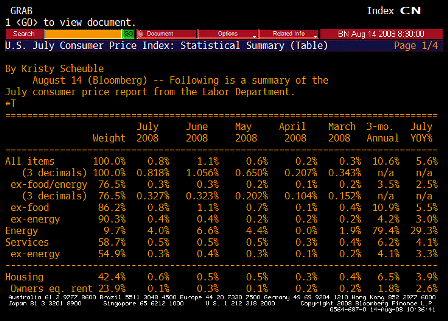
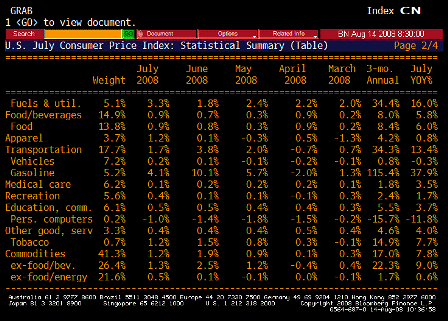
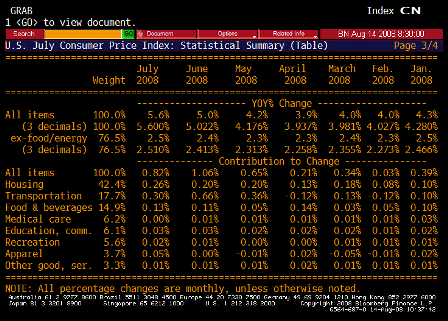
CPI TABLE 1 (Jul)

[top][end]

CPI TABLE 2 (Jul)

[top][end]

CPI TABLE 3 (Jul)

[top][end]


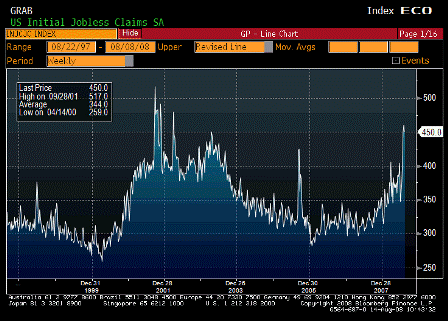
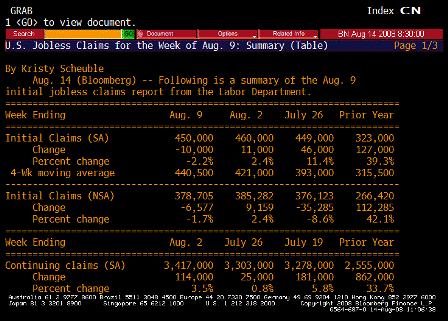
Initial Jobless Claims (Aug 9)

Survey 435K
Actual 450K
Prior 455K
Revised 460K

Up, but confused by new extended benefits.

[top][end]

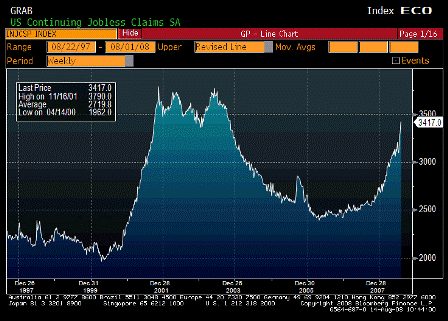
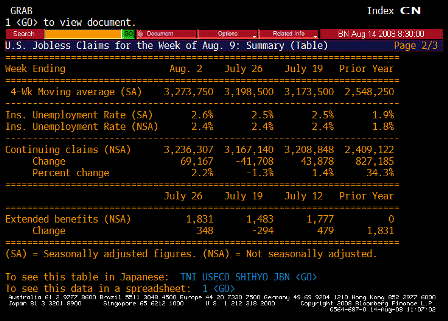
Continuing Jobless Claims (Aug 2)

Survey 3310K
Actual 3417K
Prior 3311K
Revised 3303K

Not looking good either, but how bad can it actually be with GDP north of 3%?

[top][end]

Jobless Claims TABLE 1 (Aug 9)

[top][end]

Jobless Claims TABLE 2 (Aug 9)


[top]

Last week’s initial claims summary


[Skip to the end]

On Fri, Aug 8, 2008 at 2:47 PM, Cesar writes:

  • federal extension of benefits SHOULD have no DIRECT impact on initial claims like they did in 2002
  • in 2002 part of the law required people to make an initial claim in the state system to become eligible for federal benefits, but that is not the case in 2008. The way it should work now is that the state evaluates if you are eligible for the state program when you are applying for federal program. If you are eligible for the state program you make a claim with the state and that shows up in initial claims data. If you are not eligible for the state program you make a federal claim that is counted separately and is not part of the weekly initial claims data.
  • however, the millions of notification letters that have been sent out to people who are potentially eligible for the federal program could have yielded some folks that show-up to get federal benefits, but learn they have state benefits they must exhaust first (anyone getting state benefits first would show up in initial claims)- this is a potential source for an INDIRECT “distortion” of initial claims
  • i saw Ohio had some of the highest claims data last week so i called up to learn how applications were being handled. On both calls i made they said they would file an initial claim with the state program first to make sure i was not eligible, then apply for the federal program. Applying for the state program would show up as an initial claim even if i was later rejected (interesting to note that for the last twelve months before 3/31/2008 less than 50% of people who made “initial claim” actually got first payment). If Ohio and possibly other states are actually filing an initial claim in the state system that gets counted in the weekly data in order to determine eligibility for all people applying for the federal program this would lead to a much larger distortion.


[top]

2008-08-13 JN News Highlights


[Skip to the end]

Highlights:

Economy Shrinks Annualized 2.4% On Weak Domestic Demand


Articles:

Economy Shrinks Annualized 2.4% On Weak Domestic Demand

(Nikkei) Declining consumer and capital spending contributed to pushing down Japan’s gross domestic product 0.6% in real terms from the previous quarter during the April-June period, for an annualized rate of minus 2.4%, according to preliminary data released Wednesday by the Cabinet Office.

The first contraction in four quarters was also attributed to a drop-off in exports amid the U.S. economic slowdown.

Domestic demand contracted 0.6%, with personal spending shrinking 0.5% as price hikes for a number of daily necessities dampened consumer sentiment. The weaker demand also reflected the fact that the previous quarter had one more day than in normal years because 2008 is a leap year.

Capital spending declined 0.2%, while housing investment slid 3.4%. Overall domestic demand pushed down GDP growth by 0.6 percentage point.

Exports, which had until recently driven economic growth, fell 2.3%, meaning overseas demand failed to push up GDP growth in the three months ended June.

In nominal terms, GDP contracted 0.7% for an annualized rate of minus 2.7%.

Fails to mention it grew at over 3% in the prior quarter, so the two quarter average is marginally positive. Japan data seems to have more noise than US data.

Also note the nominal measure over the last year:

Nominal GDP Q/Q:

Q2/08 -0.7%
Q1/08 +0.2%

Q4/07 -0.1%
Q3/07 flat


Lots of noise due to ‘inflation’ as they measure it.

Yes, a soft quarterly report, but as expected or slightly better than expected on most counts.

Same twin themes as the US: weakness and higher prices.

And lots of talk about a fiscal program over there.


[top]

2008-08-13 UK News Highlights


[Skip to the end]

Highlights:

BoE Cuts Growth Forecasts, Jobless Climbs
U.K. Unemployment Rose the Most Since 1992 in July
Surge in credit card debt charge-offs
U.K. Homebuilders Fall as Unemployment Rise May Worsen Slump


Article snip:

BoE Cuts Growth Forecasts, Jobless Climbs (Bloomberg) The BoE cut its forecast for U.K. economic growth and held out the prospect of lower interest rates as unemployment rose the most in almost 16 years in July. Governor Mervyn King said the inflation rate will fall below the 2 % target in two years if policy makers keep the benchmark interest rate at 5 %.

But not if they cut is the implication as well.


[top]

2008-08-13 China News Highlights


[Skip to the end]

They know how to keep it all going:

(Bloomberg) “Demand for investment is still the one to depend on for dealing with potential external shocks,” because local consumption is not enough to be the main engine of China’s growth, said the center, affiliated with the National Development and Reform Commission. “All levels of government should prepare a list of investment projects in urban transport and infrastructure so that they can be launched immediately once needed.”


[top]

2008-08-13 US Economic Releases


[Skip to the end]


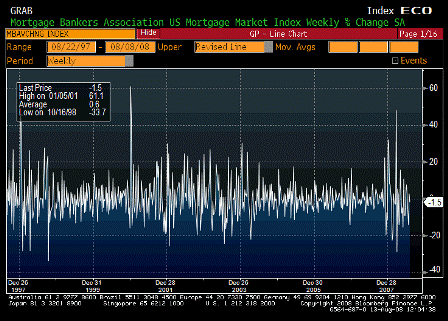
MBA Mortgage Applications (Aug 8)

Survey n/a
Actual -1.5%
Prior 2.8%
Revised n/a

Muddling through on the low side as mortgage bankers lose market share to banks.

[top][end]
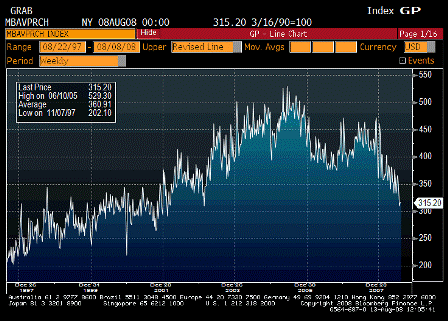
MBA Purchasing Index (Aug 8)

Survey n/a
Actual 315.2
Prior 315.2
Revised n/a

Flat at low levels.

May do better as the seasonal adjustments get easier.

[top][end]
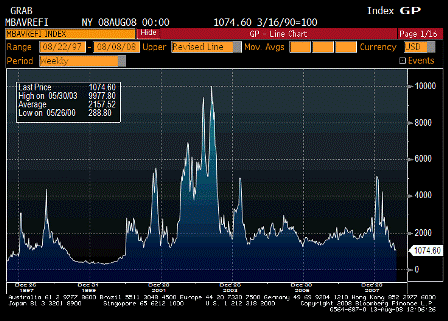
MBA Refinancing Index (Aug 8)

Survey n/a
Actual 1074.6
Prior 1121.8
Revised n/a

Slowing, as bulk of resets are past and rates are doing nothing.

[top][end]
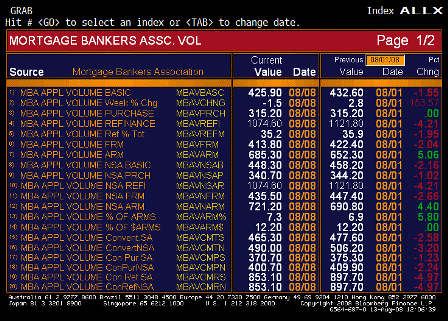
MBA ALLX 1 (Aug 8)

[top][end]
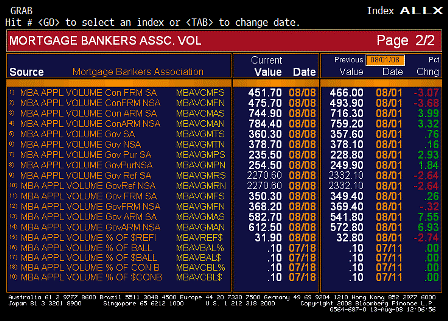
MBA ALLX 2 (Aug 8)

[top][end]
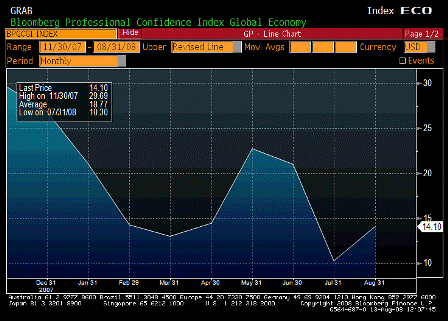

Bloomberg Global Confidence (Aug)

Survey n/a
Actual 14.10
Prior 10.30
Revised n/a

Low, but improving.

[top][end]


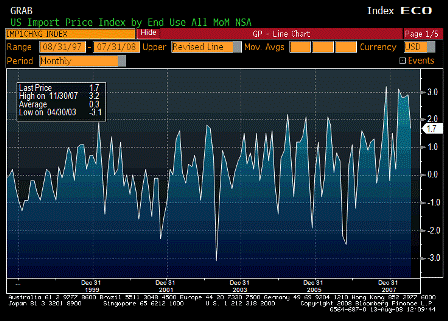
Import Price Index MoM (Jul)

Survey 1.0%
Actual 1.7%
Prior 2.6%
Revised 2.9%

Scary stuff if you are responsible for the value of the currency.

[top][end]
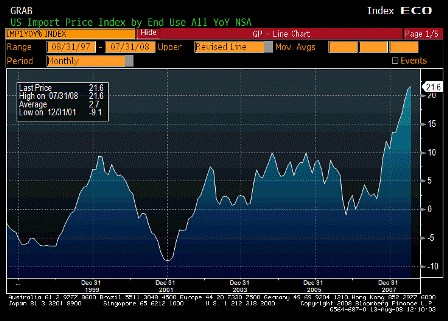
Import Price Index YoY (Jul)

Survey 20.4%
Actual 21.6%
Prior 20.5%
Revised 21.1%

‘Inflation’ flooding in through the open window.

[top][end]
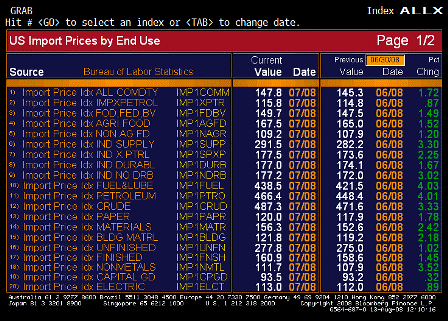
Import Price Index ALLX 1 (Jul)

[top][end]
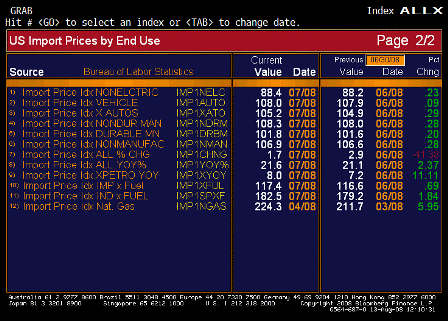
Import Price Index ALLX 2 (Jul)

Karim writes:

Import prices continue uptrend

  • Headline +1.7% m/m; ex-petroleum up 0.9% m/m

Yes and ex petro 8% year over year and still rising. And this takes time to pass through to core CPI.

  • Expect headline to be below core for the next few mths though

Yes, if gasoline stays down.

But rental vacancies took a small turn down, and owner equivalent rent already printed a 0.3%, and seems with starts so far down there has to be a shortage of actual units available to live in. Also, lots of catching up to do in other core measures, like medical and others which had some prints on the low side.

All of their costs are rising and push up prices with various lags.

And Russia has demonstrated they can do whatever they want and there’s nothing anyone can do about it.

Not good…

[top][end]
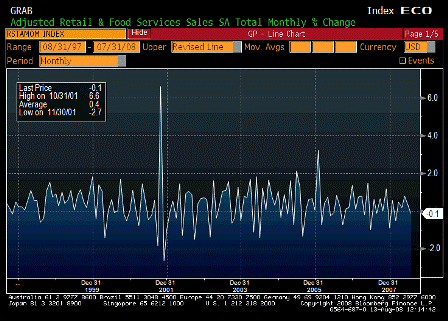

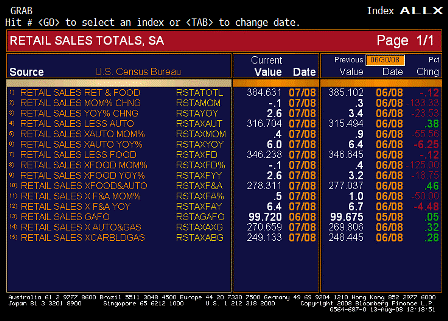
Advance Retail Sales MoM (Jul)

Survey -0.1%
Actual -0.1%
Prior 0.1%
Revised 0.3%

Down some as expected due to weak car sales, but prior month revised up.

Sometimes if people don’t buy cars they buy other things…

[top][end]
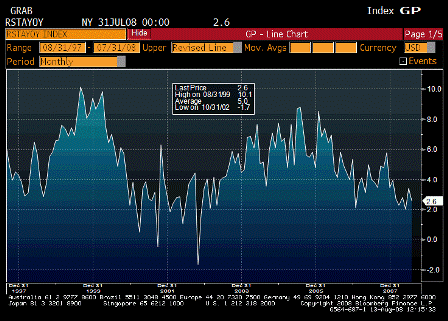
Advance Retail Sales YoY (Jul)

Survey n/a
Actual 2.6%
Prior 3.4%
Revised n/a

Still looks to be moving off a bottom.

[top][end]
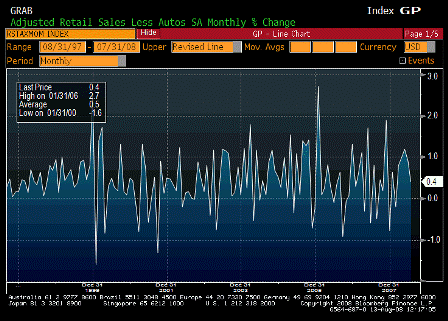
Retail Sales Less Autos MoM (Jul)

Survey 0.5%
Actual 0.4%
Prior 0.8%
Revised 0.9%

Looks okay, a tenth below expectations but prior month revised up the same tenth.

[top][end]
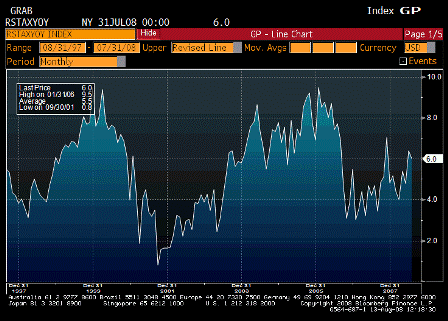
Retail Sales Less Autos YoY (Jul)

Survey n/a
Actual 6.0%
Prior 6.4%
Revised n/a

Looking reasonably firm.

[top][end]

Advance Retail Sales ALLX (Jul)

On Wed, Aug 13, 2008 at 8:54 AM, Karim writes:

Retail sales generally weak but in line with expectations

  • Headline -0.1% m/m; ex-gas -0.2% m/m; ex-autos +0.4%; control group +0.3%
  • Rebate checks did trickle in through July so some help from there
  • Looks like real PCE off to flat start in Q3, perhaps explaining Fisher’s remark yesterday that ‘we will broach zero growth’ in the second half of the year

The FOMC now has a multi year history of underestimating GDP and inflation.

Seems with Q2 GDP now looking like 3% or more, and the first half therefore averaging maybe over 2%, and year over year gdp still pushing 3%, they would either adjust or downgrade their GDP forecasting model.

Same with their inflation forecasting model, as cpi moves through 5% and core elevates from levels not long ago forecast at not a lot more than half that.

Looking more and more like the real economy did bottom in Q4 2007, as private forecasters are now starting to project positive gdp for Q3 and Q4, and some for Q1 2009 as well.

And even if the saudis keep crude at current levels core cpi should continue to march higher for many more quarters as it all catches up to the shift from $20 crude to $100+ crude.

Yes, the financial sector continues to have issues, may severe, but blood is flowing around the clot as the real economy moves forward.

Housing starts peaked in the early 1970s at 2.6 million with only 215 million people and no secondary market or housing agencies- just a bunch of dumb s and l’s taking in deposits and making mortgages (is used to work at one back then).

Today with 50% more people we call 2 million units gangbusters.

The financial innovation is all predatory at the macro level, though at the micro level we’d grown dependent on it for sure.

Yes, US exports are reducing foreign GDP growth, but their are signs they are moving to support domestic demand with fiscal measures, including Japan, the UK, and even some talk from the eurozone, and even china announced lower inflation numbers to justify supporting growth.

And Saudi crude output shows no sign of world net supply going up. Current price action just some kind of massive ‘inventory adjustment’.

Yes, that can change but hasn’t yet.

[top][end]
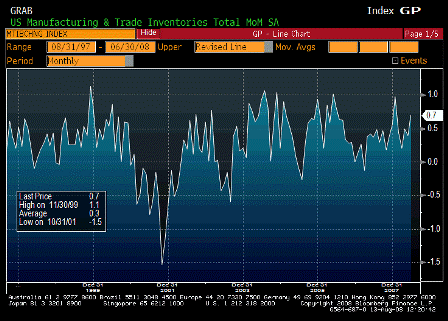

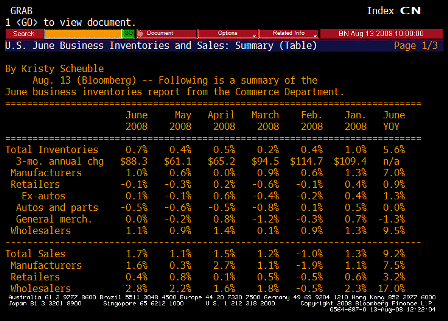
Business Inventories MoM (Jun)

Survey 0.5%
Actual 0.7%
Prior 0.3%
Revised 0.4%

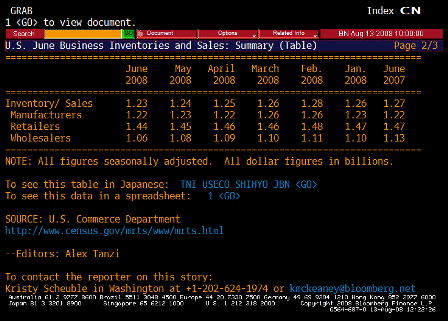
3% Q2 GDP means more inventory is needed.

Also, this and previous inventory data for June higher than expected which means Q2 might be revised up that much more as very low inventory levels were estimated with the initial 1.9% release for Q2 GDP.

[top][end]
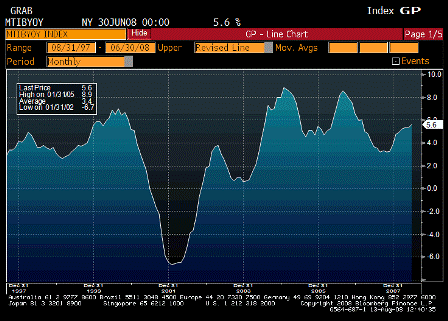
Business Inventories YoY (Jun)

Survey n/a
Actual 5.6%
Prior 5.3%
Revised n/a

Not the usual recession pattern.

The real sector seems well managed.

The financial sector is another story. They don’t count mbs inventory, for example, in this series…

[top][end]
Business Inventories TABLE 1 (Jun)

[top][end]
Business Inventories TABLE 2 (Jun)


[top]
2008-08-12 Saudi Oil Output


[Skip to the end]

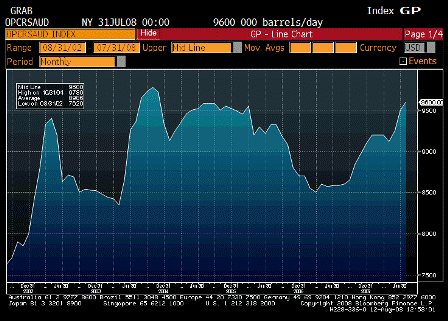
Saudi Oil Output

The Saudi production increase tells me world demand was up, even at the higher prices.

Yes, US demand was down 800,000 bpd vs last year, and yes other world demand may fall.

Only when demand for Saudi output falls sufficiently will they be dislodged from being swing producer and price setter.

That is not to say they won’t continue to disguise their role as best they can, and allow volatility as various world inventory positions (cash and futures) are being liquidated, as is probably the case currently.

Saudi output is also getting very near capacity of maybe 11 million bpd.

If demand goes above that they lose control of price on the upside.


[top]

AGY MBS UPDATE: 08/12/08


[Skip to the end]

On Tue, Aug 12, 2008 at 5:18 PM, Andrew wrote:

AGY MBS UPDATE: 08/12/08

General Themes:

  • Mortgages were weaker to dealer hedge ratios – versus CXLs they were down only -5cents
  • The small CXL daily price change masks what was a pretty bad performance for mortgages
  • Dealer OAS’s are back to the wides of last week – Lehman has FN5.5 LOAS at +90bps
  • What could help mortgages?
  • Asian buying returning
  • Capital raising by the GSE’s, (or capital injection by Tsy)
  • Reduced capital surplus guidelines from OFHEO
  • Convexity led rally in rates

not to mention investors recognizing value vs tsy’s, atraight agency paper, quality AAA corporates, libor, and other lower yielding paper


[top]

2008-08-12 US Economic Releases


[Skip to the end]


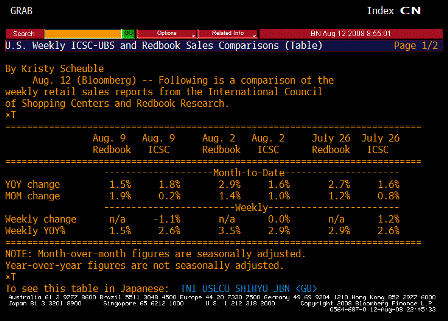
ICSC-UBS Store Sales WoW (Aug 12)

Survey n/a
Actual -1.1%
Prior 0.0%
Revised n/a

[top][end]

ICSC-UBS Store Sales YoY (Aug 12)

Survey n/a
Actual 2.6%
Prior 2.9%
Revised n/a

Year over year looking fine.

[top][end]

Redbook Store Sales Weekly YoY (Aug 12)

Survey n/a
Actual 1.5%
Prior 3.5%
Revised n/a

Softer but no collapse.

[top][end]

ICSC-UBS Redbook Comparisson TABLE (Aug 12)

[top][end]


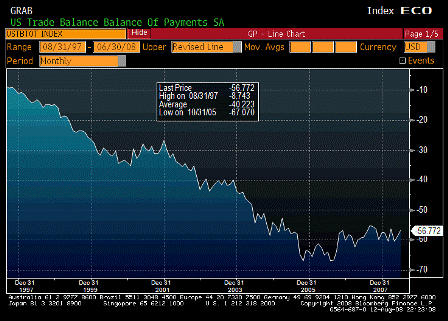
Trade Balance (Jun)

Survey -$62.0B
Actual -$56.8B
Prior -$59.8B
Revised -$59.2B

Lower than expected and moving lower even with crude prices up in June.

I still think last months number was too high which is part of the reason for the June drop.

[top][end]

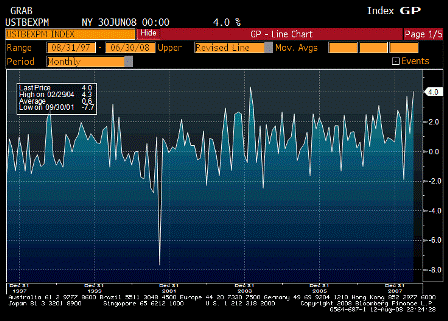
Exports MoM (Jun)

Survey n/a
Actual 4.0%
Prior 1.2%
Revised n/a

Government and exports continue to support GDP.

Q2 now looking to be revised to maybe north of 3%.

[top][end]

Imports MoM (Jun)

Survey n/a
Actual 1.8%
Prior 0.3%
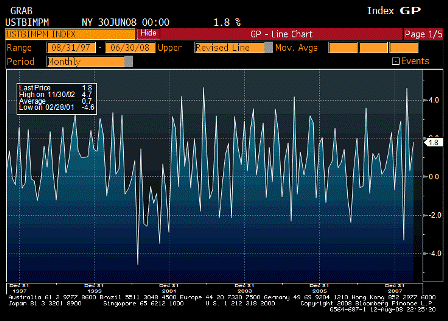
Revised n/a

Up due to crude and gasoline prices.

[top][end]

Exports YoY (Jun)

Survey n/a
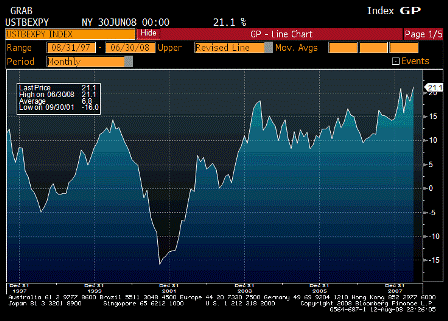
Actual 21.1%
Prior 18.2%
Revised n/a

Looking more like an export economy every day. Weak domestic consumption and ok employment.

Workers earn enough to drive to work and eat, and the rest of their output gets exported to someone else.

[top][end]

Imports YoY (Jun)

Survey n/a
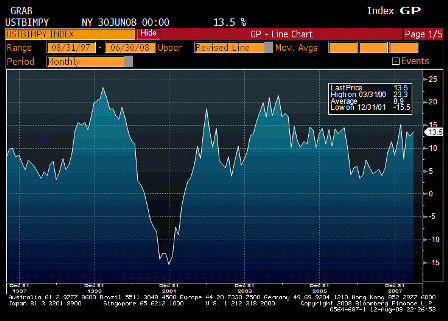
Actual 13.5%
Prior 12.5%
Revised n/a

Mostly petro and product prices.

Other imports are down.

[top][end]

Trade Balance ALLX (Jun)

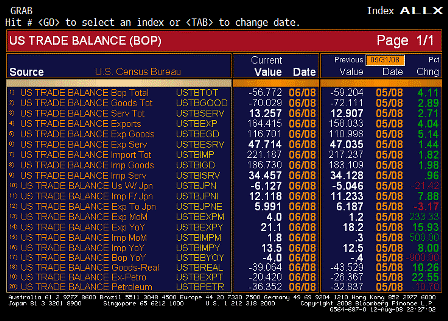
Ex petro down to about 20 billion.

[top][end]


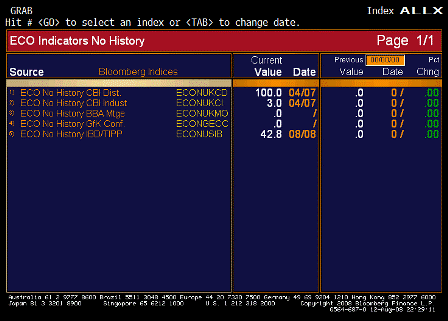
IBD-TIPP Economic Optimism (Aug)

Survey 39.0
Actual 42.8
Prior 37.4
Revised n/a

Up some, but less than expected.

[top][end]


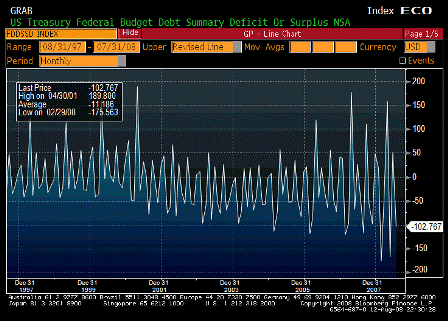
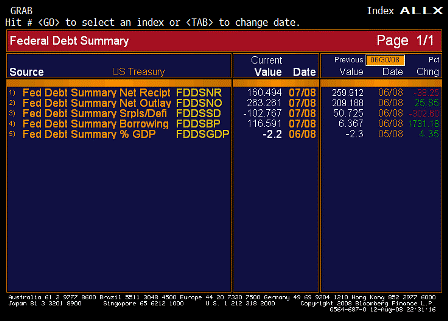
Monthly Budget Statement (Jul)

Survey -$95.0B
Actual -$102.8B
Prior -$36.4B
Revised n/a

Government spending and exports supporting GDP more than most anticipate.

[top][end]

Monthly Budget Statement ALLX (Jul)

[top][end]


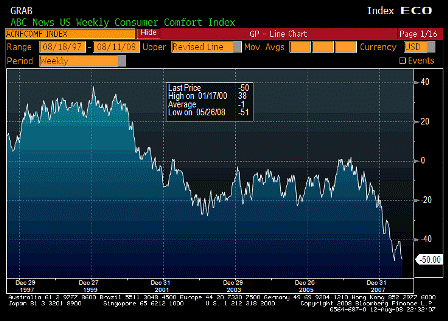
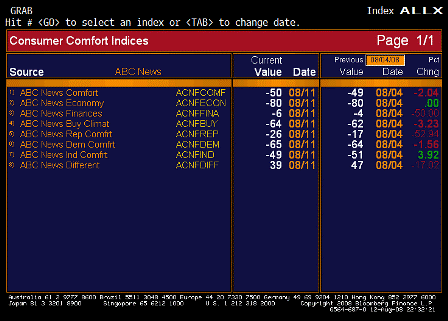
ABC Consumer Confidence (Aug 10)

Survey n/a
Actual -50
Prior -49
Revised n/a

Bumping along the bottom.

Inflation hurting confidence as wages remain ‘well contained’.

[top][end]

ABC Consumer Confidence ALLX (Aug 10)


[top]

Fed senior loan officer survey charts


[Skip to the end]
On Mon, Aug 11, 2008 at 1:25 PM, Karim writes:

  • Both lending standards and spds move up from cycle highs; appears defining aspect of the current episode may be the duration of tighter lending conditions (prior episodes approached current levels of tightness but were relatively short-lived).
  • Also of concern to Fed is chart on page 3 showing significant tightening of standards for prime residential mortgage loans (though all types of loans showed a deterioration)

http://www.federalreserve.gov/boarddocs/SnLoanSurvey/200808/charts.pdf

Yes, and note how housing showing strong signs of bottoming and GDP moving up at the same time.

Interesting to watch the blood flowing around the clot, as it necessarily does.

Though not without difficulty.


[top]