US Energy Consumption as % of GDP

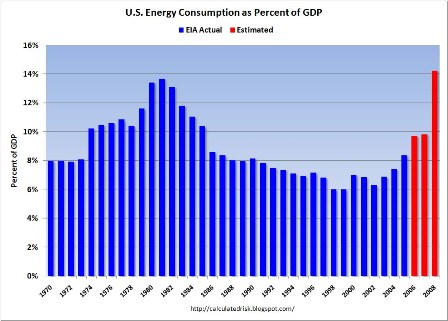
US Energy Consumption as Percent of GDP

Interesting how the price hikes get us back to the 1970s ratio. One of the arguments that it was different this time around was that crude is a lower percentage of GDP than it was then.

The pass-throughs to the rest of the price structure are just getting started, and I expect them to persist well past the peak in crude prices.

Bloomberg: Apartment vacancy unchanged, rents rise

The drop in housing starts may be keeping the rental market tight, as about a 80,000 fewer new units are being built each month.

U.S. Apartment Vacancy Unchanged at 5.9 Percent, Rents Increase

(Bloomberg) The vacancy rate for U.S. rental apartment buildings was unchanged at 5.9 percent in the second quarter as the housing slump and a weakening economy deterred people from buying homes, Reis Inc. reported.

The average monthly U.S. asking rent rose 1 percent to $1,047, the 25th consecutive quarter that rents increased or stayed the same, according to Reis, a New York-based research firm.

Home prices in 20 U.S. metropolitan areas declined in April by the most on record and new home sales fell 40 percent in May from a year ago. The slumping housing market means apartment rents should remain steady even as gasoline prices rise and U.S. companies cut jobs, Sam Chandan, chief economist for Reis, said in an interview. Payrolls fell by 62,000 in June and 438,000 in the first half, the Labor Department said July 3.

“Our projection is rent growth will moderate through 2009, but we don’t think it will turn negative as it did in the early 2000s,” Chandan said. “The bias will be weighted toward rental, in our view. People fear home prices will fall further.”

The last time U.S. rents fell was the first quarter of 2002, when they declined by 0.2 percent, according to Reis.

The five-year housing boom that ended in 2006 attracted investment to homebuilding, so fewer apartment buildings were constructed, Chandan said.

“There has been very little apartment development because all the money was made in housing development,” he said. “We don’t have a strong pipeline of apartments.”

San Francisco
San Francisco asking rents grew the most in the second quarter from the previous 12 months, increasing 9.4 percent. New York gained 7.7 percent, Seattle rose 7.4 percent, San Jose, California increased 7.3 percent and Salt Lake City increased 6.1 percent, according to Reis.

New York had the highest average U.S. rent at $2,847 a month, followed by San Francisco at $1,825, Fairfield County, Connecticut at $1,757, Boston at $1,646 and Long Island, New York at $1,521, Reis said.

Orange County, California, ranked sixth at $1,520, followed by San Jose at $1,504, Northern New Jersey at $1,460, Ventura County, California at $1,409 and Los Angeles at $1,408, according to Reis.

New York had the lowest vacancy rate at 2.2 percent, followed by Long Island at 2.9 percent, Central New Jersey at 3 percent, San Jose at 3.2 percent and New Haven, Connecticut at 3.3 percent, Northern New Jersey at 3.5 percent, Syracuse, New York at 3.6 percent, San Diego and San Francisco at 3.8 percent and Minneapolis at 3.0 percent, Reis said.

The Independent: UK Bank deputy chief warning

Bank deputy chief warns of market trouble to come

by Ben Russell, Political Correspondent and Sean O’Grady

Britain is facing the risk of renewed turmoil in the financial markets, the new deputy governor of the Bank of England warned yesterday.

Professor Charlie Bean, the deputy governor for monetary policy and a former chief economist at the Bank, raised the prospect of a slowing global economy triggering a new round of problems with corporate loans and said that the impact of the credit squeeze could be greater than Bank projections.

Yes, but unlike the Eurozone, the BoE is permitted to ‘write the check’ as in the treasury.

National solvency is not an issue in the UK as it is in the Eurozone when weakness is addressed.

He told members of the Commons Treasury Select Committee that Britain faced “major conflicting risks” threatening the Government’s inflation target from the problems of a slowing economy and rising commodity prices.

Yes, the twin themes of weakness and inflation.

In a memorandum to the committee, Professor Bean warned that the “dislocation” in the financial markets “probably has further to run, especially if a slowing economy here and abroad generates a second round of write-downs, this time associated with corporate loans. Moreover, the impact of the tightening in the terms of availability of credit could prove greater than is embodied in the central case in our most recent set of projections”.

Agreed. And while ‘writing the check’ can readily address these issues with no risk to government solvency, it will also support the higher prices he next discusses:

He said that increasing oil and other commodity price rises would lead to higher inflation becoming “embedded in the economy”, warning that people might seek to offset price increases by making higher wage demands. He said: “There is no doubt that the UK economy presently faces the most challenging set of circumstances since at least the early 1990s and probably earlier.”

Professor Bean said oil prices could continue to rise for another two years and cautioned that Britain faced the danger of a pay-price spiral if workers tried to compensate by pushing up wages. He said: “It certainly poses a significant challenge. There is no doubt about that at all. It may be a relatively unlikely event but it could be particularly unfortunate if it happened, if households and businesses start losing faith in the idea that inflation will stay low, round about the target, they start building it into their pay and prices and inflation becomes much more embedded into the system… Provided pay growth remains subdued, the current pick-up in inflation will be temporary.”

Living standards, the deputy governor stressed, will inevitably be lower because of the global inflation in commodity prices.

Agreed. It’s all about real terms of trade, which have also been declining rapidly in the US as evidenced by the drop in growth of GDP and the drop in non-oil trade deficit.

My guess is the most likely political response in the US and the UK is proactive deficit spending from the treasury to address the weakness and higher interest rates to address the inflation.

Unfortunately the deficit spending that supports domestic demand will also support crude consumption (as well as housing) and ‘monetize’ the ever higher crude prices being set by the Saudis, thereby supporting ‘inflation’ in general.

And this will trigger ever higher interest rates from the Central Bank as inflation trends even higher.
2008-07-03 US Economic Releases


[Skip to the end]


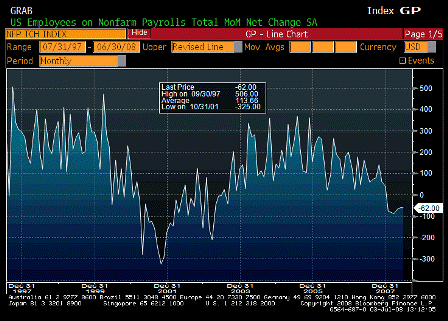
Change in Nonfarm Payrolls (Jun)

Survey -60K
Actual -62K
Prior -49K
Revised -62K

Looking soft but not collapsing.

With productivity increases, GDP can remain positive with flat to down job creation.

[top][end]


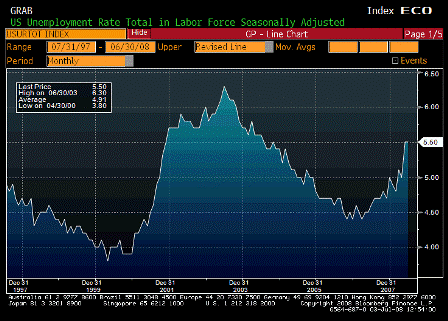
Unemployment Rate (Jun)

Survey 5.4%
Actual 5.5%
Prior 5.5%
Revised n/a

Working its way higher, but this is a lagging indicator.

[top][end]


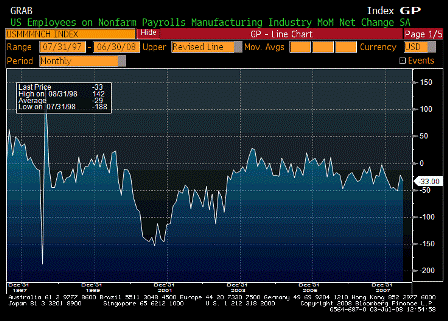
Change in Manufacturing Payrolls (Jun)

Survey -30K
Actual -33K
Prior -26K
Revised -22K

Slowly working its way lower in a multi-year trend.

[top][end]


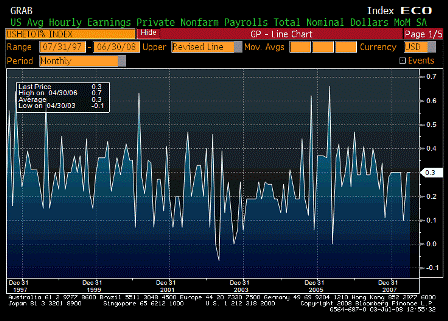
Average Hourly Earnings MoM (Jun)

Survey 0.3%
Actual 0.3%
Prior 0.3%
Revised n/a

Apparently ‘well-anchored’.

[top][end]


Average Hourly Earnings YoY (Jun)

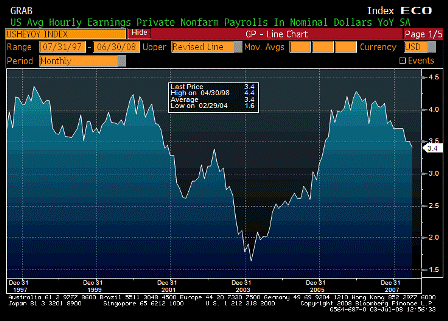
Survey 3.4%
Actual 3.4%
Prior 3.5%
Revised n/a

Still moving lower with seemingly along with the labor weakness.

[top][end]


Average Weekly Hours (Jun)

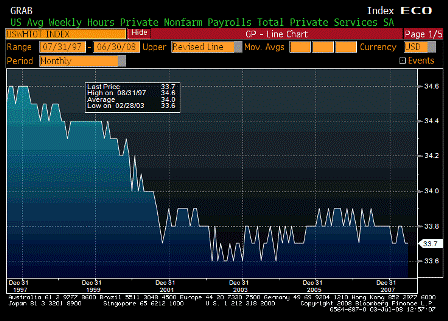
Survey 33.7
Actual 33.7
Prior 33.7
Revised n/a

This is falling off as well and indicates a good sized loss of labor hours.

[top][end]


Initial Jobless Claims (Jun 28)

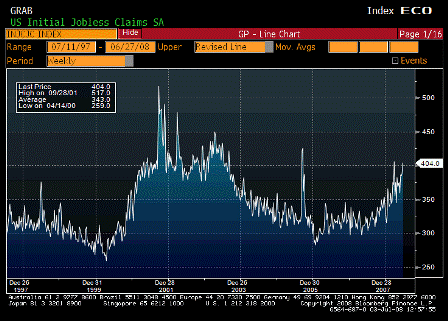
Survey 385K
Actual 404K
Prior 384K
Revised 388K

Working its way higher but still not at recession levels, and the floods might have disorted it some.

[top][end]


Continuing Jobless Claims (Jun 21)

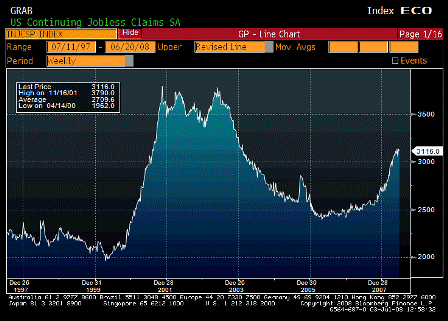
Survey 3125K
Actual 3116K
Prior 3139K
Revised 3135K

Rate of increase seems to be slowing.

Karim writes:

-62k decline in nfp in line with expectations but details on the soft side

  • Net revisions -52k
  • Unemployment rate stays at 5.5%
  • Index of aggregate hours drops again (-0.1%); 3mth annualized rate now -0.9%. If hours fall 1%, that is the equivalent of about a 1.4mm decline in jobs from a labor income perspective: Labor income = jobs x average hourly earnings x total hours worked.
  • Total augmented unemployment rate (another measure of slack that includes those who have dropped out of labor force but indicate they would like to work) rises from 9.7% to 9.9%, a new cycle high.
  • Median duration of unemployment rises from 8.3 weeks to 10.0 weeks.
  • One piece of improvement was in diffusion index rising from 45.6 to 46.9
  • Birth-death model added 177k jobs, 29k in construction (caution that these are nsa whereas payrolls are sa)

Claims rise from 388k to 404k; 4wk avg rises from 379k to 390k.

Continuing claims fall from 3135k to 3116k; 4wk average rises from 3102k to 3110k

[top][end]


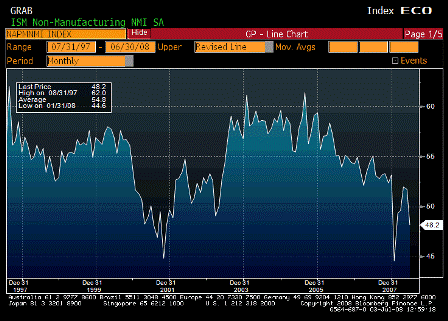
ISM Non-Manufacturing Composite (Jun)

Survey 51.0
Actual 48.2
Prior 51.7
Revised n/a

Seems to be back near its longer term trend line that was headed lower, and prices keep moving up alarmingly.

Karim writes:

Overall index falls from 51.7 to 48.2 in June.

Activity details also weak and prices paid higher:

  • Prices paid 77 to 84.5
  • Activity 53.6 to 49.9
  • New orders 53.6 to 48.6
  • Employment 48.7 to 43.8 (lowest in 6yr history of series)
  • Export orders 54 to 52


[top]

2008-07-02 US Economic Releases


[Skip to the end]


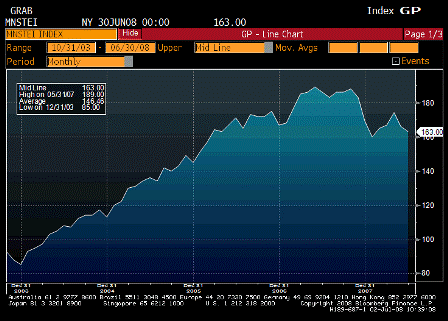
Monster Employment Index (Jun)

Survey n/a
Actual 163
Prior 166
Revised 174

Down some, previously revised up, may be starting to level off.

[top][end]


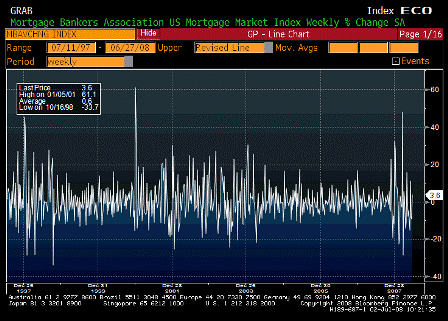
MBA Mortgage Applications (Jun 27)

Survey n/a
Actual 3.6%
Prior -9.3%
Revised n/a

[top][end]


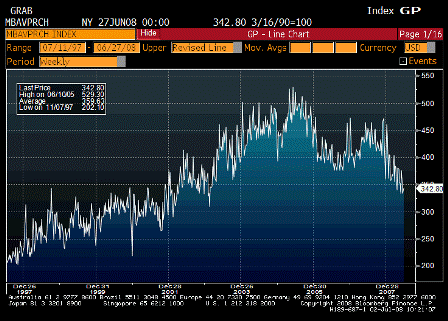
MBA Mortgage Purchases (Jun 27)

Survey n/a
Actual 342.8
Prior 333.4
Revised n/a

Up some in the new, lower range.

In the past this level of applications was associated with housing starts maybe 50% higher but what was still considered low levels.

[top][end]

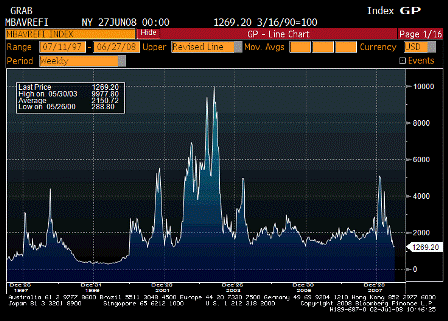
MBA Mortgage Refinances (Jun 27)

Survey n/a
Actual 1269.2
Prior 1212.2
Revised n/a

Falling off but the number of adjustable rate resets coming due has crested as well.

[top][end]


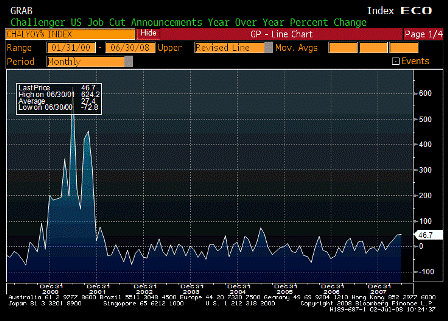
Challenger Job Cuts YoY (Jun)

Survey n/a
Actual 46.7%
Prior 45.6%
Revised n/a

Moved up some but still well off previous recession levels.

[top][end]


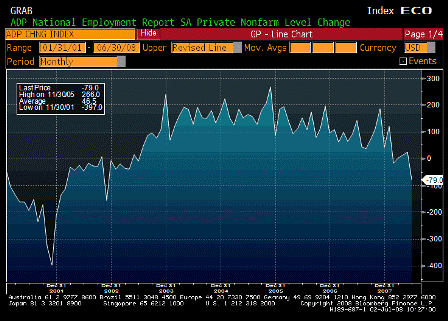
ADP Employment Change YoY (Jun)

Survey -20K
Actual -79K
Prior 40K
Revised 25K

Looks to be continuing its slow grind lower of the last few years.

The Fed sees some of this as long term demographics via a shrinking labor force participation rate.

Karim writes:

ADP for June -79k; has overstated nfp by an average of 77k per mth for past year.

NFP has been weaker than ADP every mth in 2008; it should actually be stronger as NFP includes govt payrolls.

I suppose there is always a first, but it does look like NFP could be well south of -100k tomorrow.

[top][end]


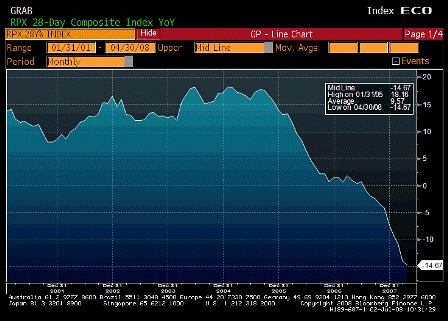
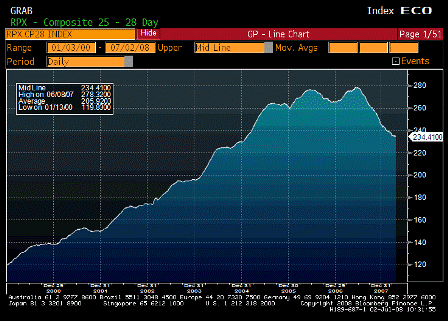
RPX Composite 28dy YoY (Apr)

Survey n/a
Actual -14.67%
Prior -13.97%
Revised n/a

[top][end]

RPX Composite 28dy Index (Apr)

Survey n/a
Actual 234.41
Prior 235.40
Revised n/a

[top][end]


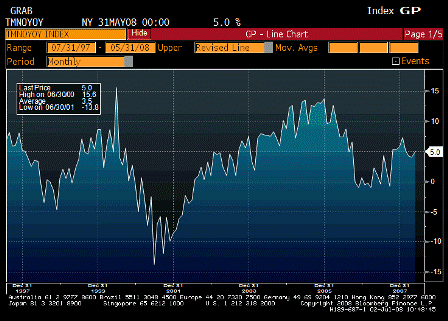
Factory Orders YoY (May)

Survey n/a
Actual 5.0%
Prior 4.0%
Revised n/a

Better than expected and actually seems to be moving up in general.

[top][end]


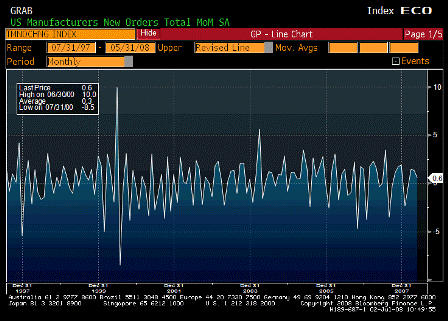
Factory Orders MoM (May)

Survey 0.5%
Actual 0.6%
Prior 1.1%
Revised 1.3%

Better than expected and last month revised up some.

[top][end]


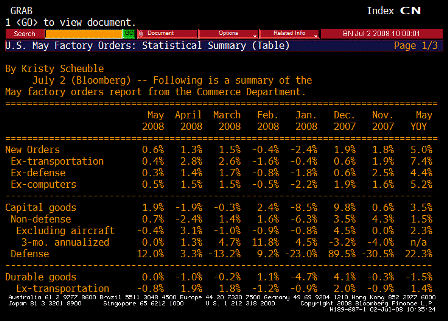
Factory Orders Table (May)

Defense kicking in – may be 2007 spending that was moved forward to 2008.


[top]

Bloomberg: Saudi Arabia not willing to see crude at discount


[Skip to the end]

Saudi Arabia Not Willing to See Crude at Discount, Naimi Says

by Fred Pals
(Bloomberg) Saudi Arabia, the world’s largest oil exporter, is not willing to sell crude oil at a discount to the normal market price for its grades of oil, the kingdom’s oil minister said.

The country plans to increase production for a third straight month this month. Analysts including the London-based Centre for Global Energy Studies have said Saudi Arabia may need to lower its prices to find sufficient buyers.

“No,” Oil Minister Ali al-Naimi said when asked about his willingness to sell crude at a discount. “Not even for heavy crude. That is not the way the market works. We have said we don’t like high prices. We have nothing to do with where the price is today. Where is the buyer? We would be very happy to sell.”

Al-Naimi spoke to reporters today at the World Petroleum Congress in Madrid.

Right, you can have all you want at their price.

Simple monopoly.

Good luck to us – we don’t even know it’s happening.


[top]

2008-07-01 US Economic Releases


[Skip to the end]


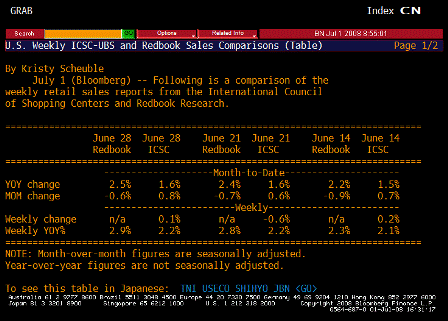
ICSC-UBS Store Sales Weekly Change (Jul 1)

Survey n/a
Actual 0.1
Prior -0.6
Revised n/a

Muddling through as govt spending and fiscal rebates offer support.

[top][end]


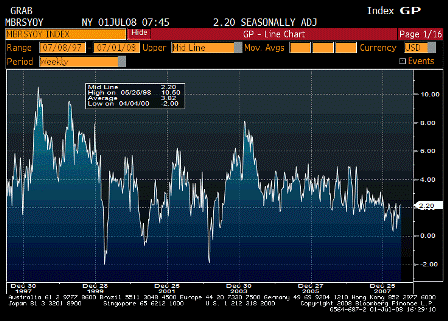
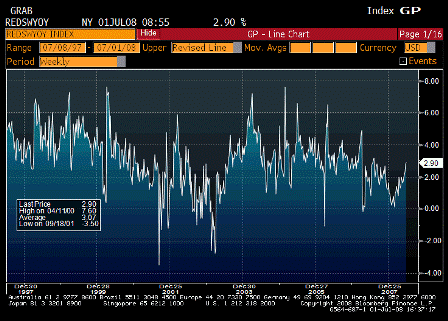
Redbook Weekly YoY (Jul 1)

Survey n/a
Actual 2.9
Prior 2.8
Revised n/a

A bit better than expected and seem to be moving higher.
[top][end]


ICSC-UBS and Redbook TABLE (Jul 1)

Survey n/a
Actual n/a
Prior n/a
Revised n/a

[top][end]


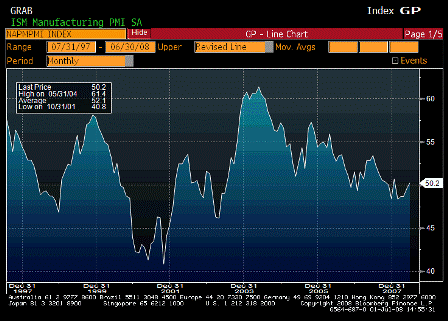
ISM Manufacturing (Jun)

Survey 48.5
Actual 50.2
Prior 49.6
Revised n/a

Better than expected, headline looks better than the detail, but holding up well above recession levels.

[top][end]

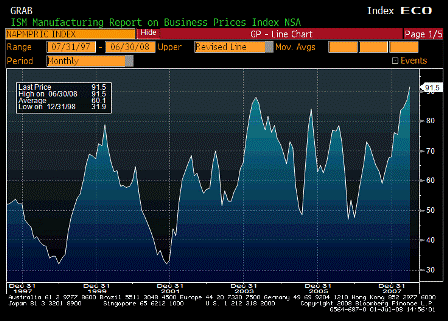
ISM Prices Paid (Jun)

Survey 87.0
Actual 91.5
Prior 87.0
Revised n/a

Breaking out. Question is whether there’s any level of inflation that will trigger a fed rate hike if GDP and financial conditions (whatever that means) stay at current levels.

[top][end]

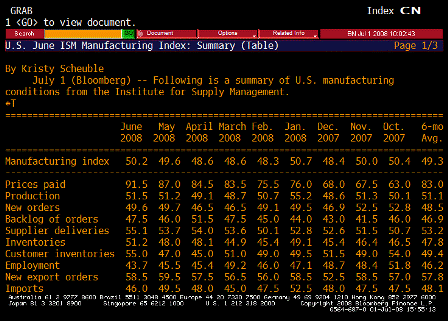
ISM TABLE (Jun)

Karim writes:

  • Not much change in headline or production/new order components.
  • Most material changes in prices paid (up 4.5; to new cycle high) and employment (down 1.8; to new cycle low).

Kohn’s speech: tolerate higher unemployment and higher inflation.

  • Based on continuing claims, conference board, and now ism, downside risk to -60k consensus for nfp on Thursday.

Weak, but not recession levels yet.

Government plus exports so far have made up for weak non-government domestic demand.

[top][end]


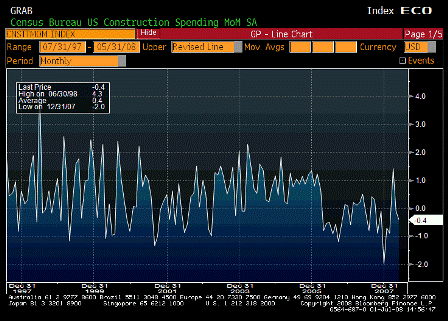
Construction Spending MoM (May)

Survey -0.6%
Actual -0.4%
Prior -0.4%
Revised -0.1%

A bit better than expected. Down but not terrible.

[top][end]


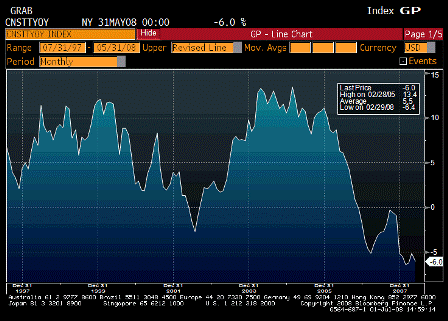
Construction Spending YoY (May)

Survey n/a
Actual -6.0%
Prior -5.1%
Revised n/a

Still near the lows, but a possible bottoming action.

[top][end]


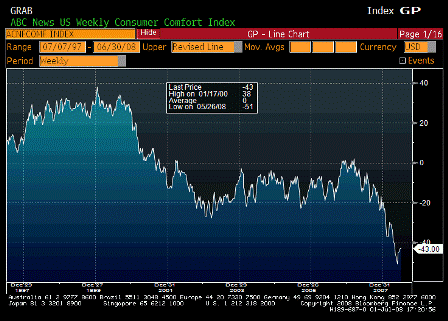
ABC Consumer Confidence (Jun 29)

Survey n/a
Actual -43
Prior -43
Revised n/a

Still looking pretty grim, probably mostly due to higher prices.


[top]