Mike Norman’s show
Wednesday, July 16, 2008 @ 10:20 EST
Houston Area: Houston 1110 AM KTEK
Dallas / Fort Worth Area: DFW 1110 AM KJSA
[top]

Wednesday, July 16, 2008 @ 10:20 EST
Houston Area: Houston 1110 AM KTEK
Dallas / Fort Worth Area: DFW 1110 AM KJSA
[top]
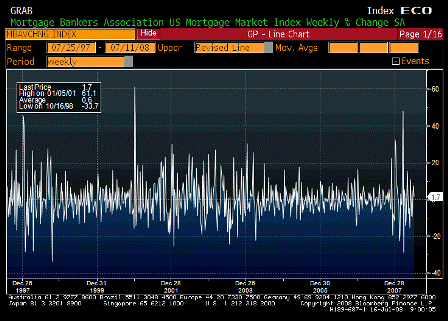
| Survey | n/a |
| Actual | 1.7% |
| Prior | 7.5% |
| Revised | n/a |

| Survey | n/a |
| Actual | 359.7 |
| Prior | 365.8 |
| Revised | n/a |
Minor down tic, still in a range that used to be indicative of 1.5 million housing starts per year, vs today’s approx 1 million.

| Survey | n/a |
| Actual | 1474.9 |
| Prior | 1379.3 |
| Revised | n/a |
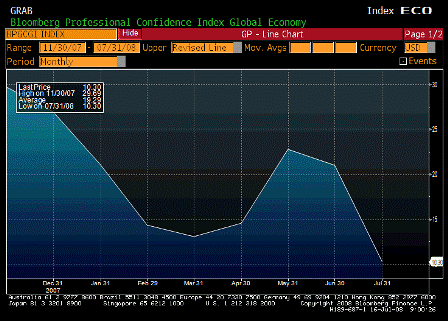
| Survey | n/a |
| Actual | 10.30 |
| Prior | 21.01 |
| Revised | n/a |
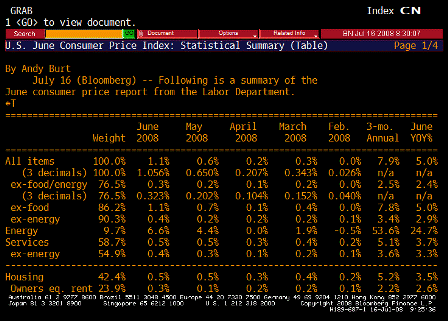
Inflation and falling equity markets are getting everyone down.
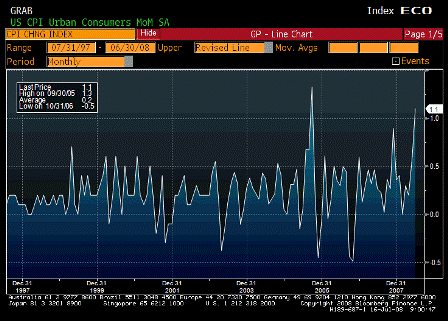
| Survey | 0.7% |
| Actual | 1.1% |
| Prior | 0.6% |
| Revised | n/a |
Higher than expected.
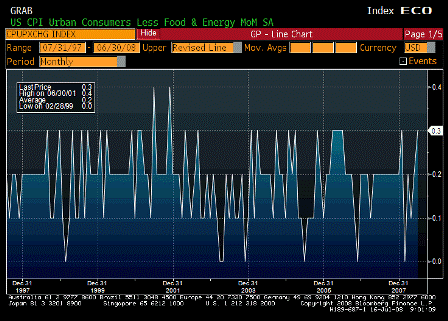
| Survey | 0.2% |
| Actual | 0.3% |
| Prior | 0.2% |
| Revised | n/a |
Headline leaking into core.
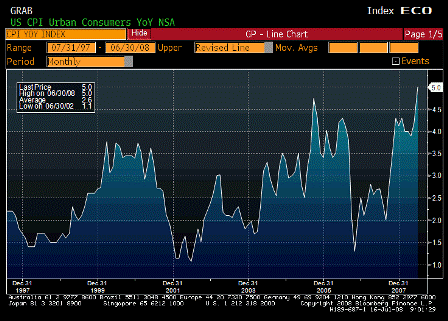
| Survey | 4.5% |
| Actual | 5.0% |
| Prior | 4.2% |
| Revised | n/a |
Breakout!
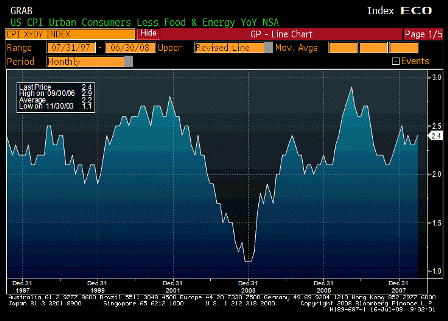
| Survey | 2.3% |
| Actual | 2.4% |
| Prior | 2.3% |
| Revised | n/a |
If it was a relative value story, this would be a lot lower and going down.
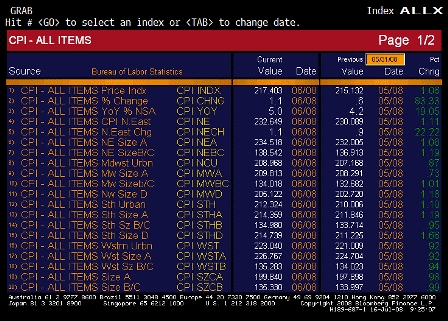
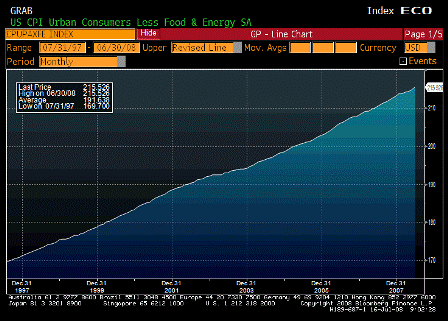
| Survey | n/a |
| Actual | 215.526 |
| Prior | 214.832 |
| Revised | n/a |
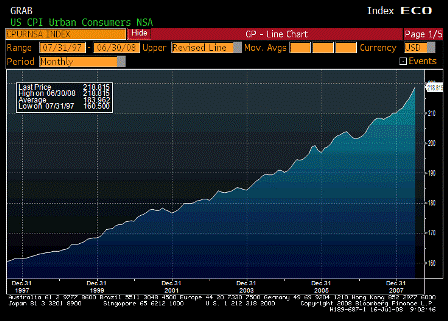
| Survey | 217.903 |
| Actual | 218.815 |
| Prior | 216.632 |
| Revised | n/a |
Karim writes:
Above Fed’s comfort zones.
In the 70’s I recall core passing 3% about the time headline passed 6%.
Click to see CPI Charts and CPI Table from the 1970s.
The difference there is no supply response for crude oil in sight this time.
Weak demand isn’t yet bringing CPI down as the Fed has been forecasting.
Weak occupancy hasn’t brought this measure down.
Maybe, but lower car sales may not bring prices down over time due to cost issues.
Costs rising here at well. And most employees probably get CPI increases.
Yes, and he and Vice Chair Kohn will have their hands full with the hawks at the August
Yes. Keeps this series lower than CPI until we’re down to eating bread and water, as deteriorating real terms of trade weigh on our standard of living.

| Survey | $70.0B |
| Actual | $67.0B |
| Prior | $115.1B |
| Revised | n/a |

| Survey | n/a |
| Actual | -$2.5B |
| Prior | $60.6B |
| Revised | $61.6B |
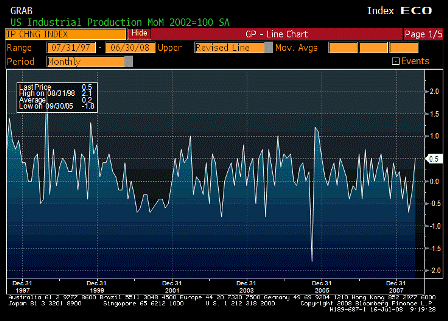
| Survey | 0.1% |
| Actual | 0.5% |
| Prior | -0.2% |
| Revised | n/a |
Better then expected.
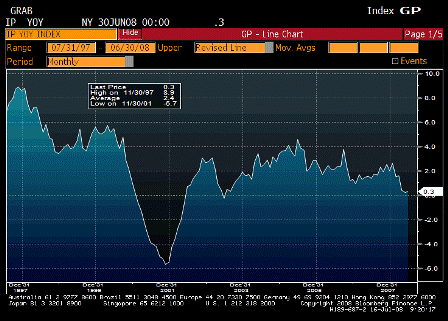
| Survey | n/a |
| Actual | 0.3% |
| Prior | 0.1% |
| Revised | 0.2% |
Seems to be working its way lower over time. May be stabilizing with the weak USD.
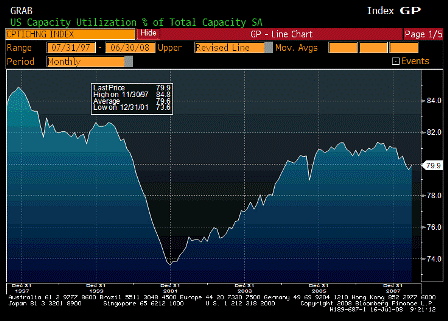
| Survey | 79.4% |
| Actual | 79.9% |
| Prior | 79.4% |
| Revised | 79.6% |
Higher than expected. The Fed is counting on slack to bring ‘inflation’ down.

| Survey | 18 |
| Actual | – |
| Prior | 18 |
| Revised | – |
[top]
The last few Michigan surveys had one-year inflation expectations over 5%.
This is not lost on an FOMC that believes inflation expectations cause inflation.
Chairman Bernanke said this yesterday after outlining the inflation expectations/inflation process:
“A critical responsibility of monetary policy makers is to prevent that process from taking hold.”
‘Prevent’ implies action, not ‘monitoring’.
Might just be a poor choice of words.
[top]
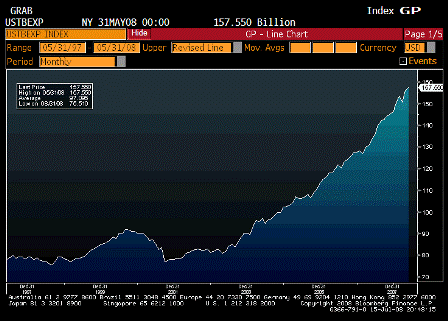
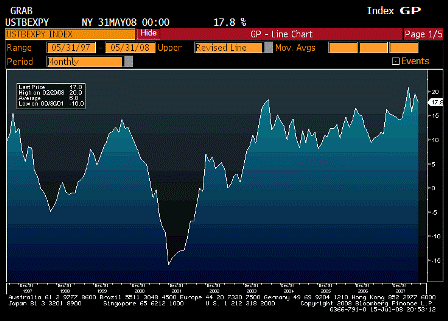
This is what happens when non residents are scrambling to reduce their hoards of USD financial assets.
Exports rising like this along with the still falling dollar indicates the current $60 billion monthly trade gap is still too high – non-residents simply don’t want to accumulate USD financial assets at that rate.
This adjustment process continually aligns the ‘real’ (price adjusted) trade gap to levels that equal foreign $US ‘savings desires’.
For the US this currently means a weak USD and a combo of rising exports and rising traded goods prices.
GDP muddles through as government spending and exports support demand, with continuing weak domestic demand and declining real terms of trade crushing the US standard of living.
[top]
Yet another economics professor gets it right!
September 02, 2007
Exports are Costs; Imports are Benefits
by Don Boudreaux
Today’s edition of the Chicago Tribune published this letter of mine:
You’re correct that free trade likely would create more opportunities for workers in Illinois to produce goods for export (“How free trade boosts Illinois,” Editorial, Aug. 25). Never forget, though, that the ultimate benefit of trade lies not in what people must sacrifice-not in the creation of opportunities to produce output for others-but in the greater quantity, quality and variety of goods and services that free trade makes possible for ordinary people to consume. Free trade’s bountiful harvest is not its exports; it is its imports.
Donald J. Boudreaux
Chairman, Department of Economics
George Mason University
Fairfax, Va.
[top]
(an email exchange)
> On Tue, Jul 15, 2008 at 11:03 AM, Mike wrote:
>
> Should we be looking at selling protection on USTs for 20bps?
>
makes sense
And makes even more sense for the Fed to be selling it:
>
>
> Sov CDS: ny open 15Jul08
>
> Credit 5yr 10yrket Credit 5yr 10yr
> Austria 12.5/15.5 17.0/18.5 Ireland 27.5/30.5 37.0/39.0
> Belgium 19.0/22.0 26.5/29.0 Italy 41.0/43.0 51.5/53.5
> Denmark 10.0/12.5 15.0/17.5 Nether 10.5/12.5 15.0/17.0
> Finland 10.0/12.5 15.0/17.5 Portug 38.0/40.0 48.0/50.0
> France 11.0/13.0 15.0/17.5 Spain 38.0/40.0 47.5/49.5
> Germany 6.0/8.0 9.75/10.75 Sweden 10.5/12.5 15.0/17.0
> Greece 51.0/53.0 61.5/63.5 UK 14.5/17.5 21.0/24.0
> Iceland 250/290 240/300 US 14.5/18.5 19.0/25.0
>
>
[top]
This is the deflation argument.
(See below)
Never seen a split quite like this with calls for both accelerating inflation and outright deflation.
Which will it be?
My guess is inflation for the US as our friendly external monopolist continues to squeeze us with ever higher crude prices.
The political process is ensuring they will be passed through as sufficient government ‘check writing’ (net government spending) is sustained to support real growth.
(Bear Stearns, housing agencies, fiscal rebates, fiscal housing package, etc.)
And the dollar continues to adjust to the sudden, politically induced shift in foreign desires to accumulate USD financial and domestic assets.
Various private Q2 GDP estimates are now up to 2% – more than sufficient to support demand and pass through the higher headline prices.
Government is never revenue constrained regarding spending and/or lending.
The limit to government check writing is the political tolerance for inflation, which grows with economic weakness.
This inflation looks to me to be far worse than the 1970s.
Back then, we were able to muster a 15 million bpd positive supply response in crude that broke OPEC by deregulating natural gas.
We don’t have that card to play this time around.
From HFE:
July 14, 2008
WORLDWIDE:
- Global Disinflation Is Going To Be The Next Big Move For The Bond Markets – Weinberg
- Commodity And Oil Prices Cannot Rise Forever… There Is No Inflation – Weinberg
- Bonds To Benefit – Weinberg
UNITED STATES:
- STOP PRESS: Treasury, Fed To Make Credit Available To GSEs; Treasury To Seek Authority To Buy Their Stocks – Shepherdson
- This Is A Lifeboat, Not a Bailout; Aim Is To Prevent Uncontained Failure – Shepherdson
CANADA:
- We Cannot Rule Out A Rate Cut Tomorrow – Weinberg
EURO ZONE:
- Core CPI Shows No Medium-Term Inflation Risks – Weinberg
- Production Data Will Be Really Soft – Weinberg
GERMANY:
- Core CPI Still Under 2% And Steady, ZEW At New Record Low – Weinberg
- … Tighter Money Is Unhelpful Here – Weinberg
UNITED KINGDOM:
- Starting Point For August QIR Forecasts To Emerge In This Week’s
- Reports: Most Inputs To The Forecasts Will Be Stronger – Weinberg
FRANCE:
- Not-Too-Scary Inflation Report Exported: Core Prices Are Steady – Weinberg
JAPAN:
- Three Soft Report This Week Will Keep Investors Moving Out Of Stocks, Into Bonds – Weinberg
AUSTRALIA:
- CPI Report For Q2, Due Next Week, May Rekindle Inflation Worries – Weinberg
CHINA:
- Exploding Foreign Borrowing Diminishes Foreign Currency Reserve Adequacy; Trends Suggest Further Decay – Weinberg
- GDP Will Be Below Recent Trend In This Week’s Report – Weinberg
[top]
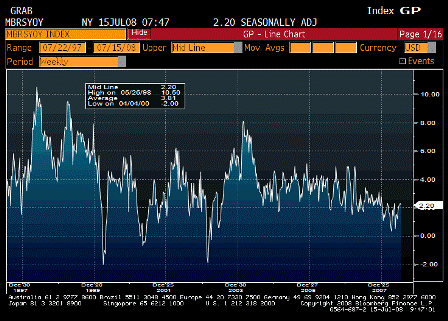
| Survey | n/a |
| Actual | 2.2% |
| Prior | 2.3% |
| Revised | n/a |
Fiscal spending seems to have stemmed the decline.
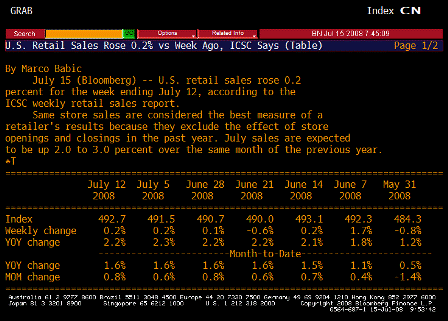
Same.
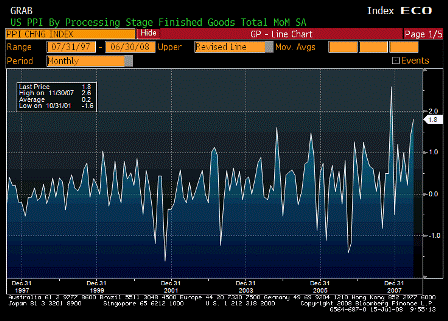
| Survey | 1.4% |
| Actual | 1.8% |
| Prior | 1.4% |
| Revised | n/a |
Looks like a banana republic with a weak currency.
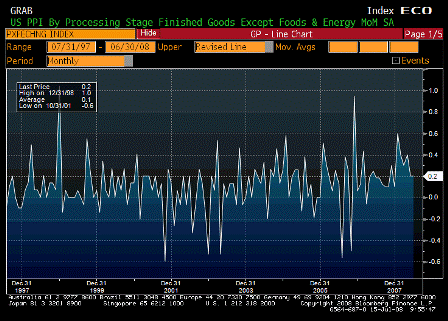
| Survey | 0.3% |
| Actual | 0.2% |
| Prior | 0.2% |
| Revised | n/a |
Also looks to be working its way higher.
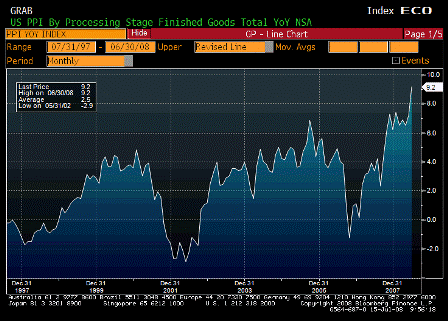
| Survey | 8.7% |
| Actual | 9.2% |
| Prior | 7.2% |
| Revised | n/a |
Inflation pouring in through the front door – import prices.
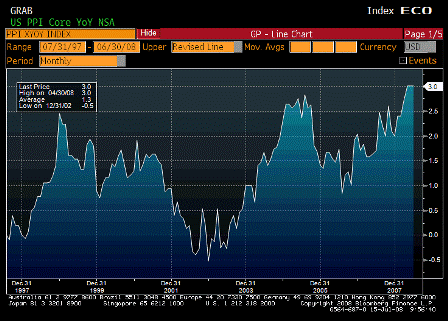
| Survey | 3.2% |
| Actual | 3.0% |
| Prior | 3.0% |
| Revised | n/a |
Looking like its on the way up, as it’s recovered and surpassed the level of Aug 06 when Goldman changed their commodity index and triggered massive selling of gasoline.
The Fed is watching for headline to leak into core, which they’ve said is already happening.
When only food/crude/import prices go up, it’s a relative value story, as funds to buy that stuff mean less to buy other things, and they lag in price.
But in this case core measures are not going down to offset headline numbers.
True, they haven’t gone up that much yet, but they have gone up rather than down.
That means that yes, demand is ‘weak’ and unemployment creeping up,
But demand is still strong enough to support both higher headline CPI and rising core measures as well,
Supported by government spending which is not revenue constrained nor liquidity constrained,
And supported by booming exports as non residents trip over each other trying to spend their now unwanted multi $trillion hoard of US financial assets.
Current levels of demand are more than sufficient to support much higher levels of housing starts (though still low levels), relatively flat employment, and rising core inflation measures.
And US real terms of trade continue to deteriorate along with the standard of living as a foreign oil monopolist exacts ever higher relative prices.
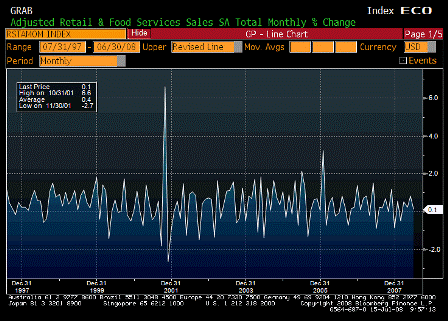
| Survey | 0.4% |
| Actual | 0.1% |
| Prior | 1.0% |
| Revised | 0.8% |
Lower than expected, due to weaker than expected auto sales, due to the wrong vehicles on the showroom floors, which will take a while to correct.
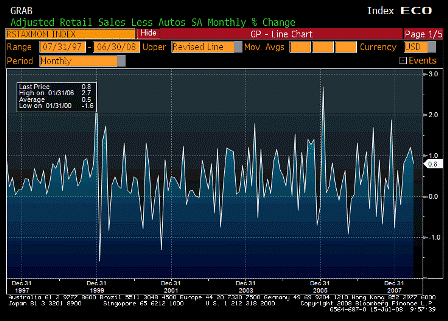
| Survey | 1.0% |
| Actual | 0.8% |
| Prior | 1.2% |
| Revised | n/a |
A little weaker than expected but pretty good from a strong previous month.
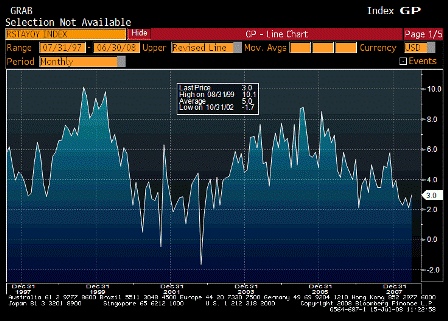
| Survey | n/a |
| Actual | 3.0% |
| Prior | 2.1% |
| Revised | n/a |
Once again fiscal policy, not monetary policy, stops the slide.
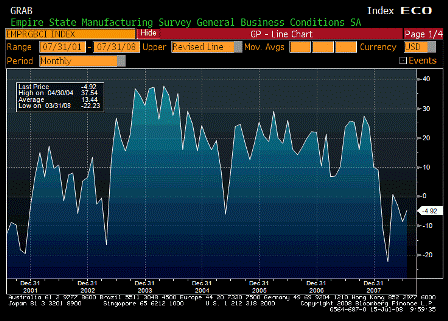
| Survey | -8.0% |
| Actual | -4.9% |
| Prior | -8.7% |
| Revised | n/a |
May be on the mend from the lows.
Karim writes:
Right, Redbook sales show same moderate growth in non-auto sales. The wrong vehicles are on the showroom floors right now and it will take a while for the right ones to take their place.
I have no idea what’s driving lower medical costs and whether further declines are to be expected, but seems highly unlikely.
The dollar’s down again today.
‘Inflation’ is flowing in through that channel like water through a screen door on a submarine.
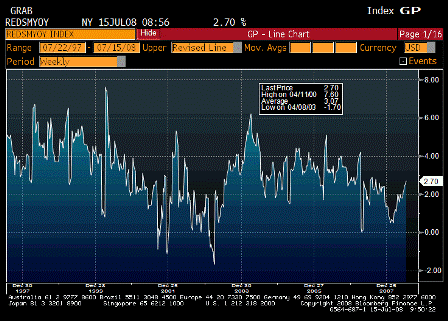
| Survey | n/a |
| Actual | 2.7% |
| Prior | 2.6% |
| Revised | n/a |
Moving up as fiscal policy kicks in.
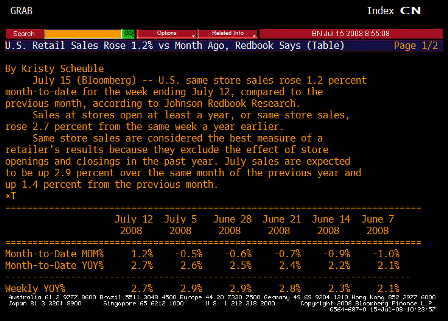
| Survey | 36.8 |
| Actual | 37.4 |
| Prior | 37.4 |
| Revised | n/a |
A little better than expected.
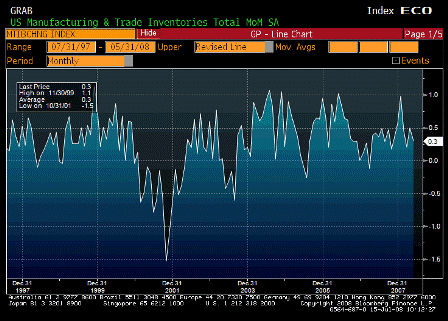
| Survey | 0.5% |
| Actual | 0.3% |
| Prior | 0.5% |
| Revised | n/a |
Possible that sales may be exceeding estimates and lowering inventories.
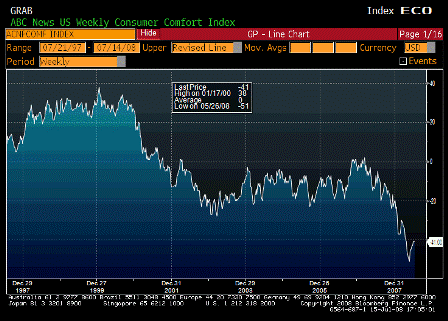
| Survey | -41 |
| Actual | -41 |
| Prior | -41 |
| Revised | n/a |
Seems to have bottomed, but remains at low levels, probably due to inflation.
[top]
Doesn’t look like a funding operation.
Looks like JPM sold the Bear Stearns securities to the Fed and retained a first loss piece:
Text in JP Morgan’s 10Q:
“Concurrent with the closing of the merger, the Federal Reserve Bank of New York (the “FRBNY”) will take control, through a limited liability company (“LLC”) formed for this purpose, of a portfolio of $30 billion in assets of Bear Stearns, based on the value of the portfolio as of March 14, 2008. The assets of the LLC will be funded by a $29 billion, 10-year term loan from the FRBNY, and a $1 billion, 10-year note from JPMorgan Chase. The JPMorgan Chase note will be subordinated to the FRBNY loan and will bear the first $1 billion of any losses of the portfolio. Any remaining assets in the portfolio after repayment of the FRBNY loan, the JPMorgan Chase note and the expense of the LLC, will be for the account of the FRBNY.”
[top]