- GDP QoQ Annualized (Released 8:30 EST)
- GDP Price Index (Released 8:30 EST)
- GDP ALLX (Released 8:30 EST)
- Personal Consumption (Released 8:30 EST)
- Core PCE QoQ (Released 8:30 EST)
- Personal Consumption ALLX 1 (Released 8:30 EST)
- Personal Consumption ALLX 2 (Released 8:30 EST)
- Employment Cost Index (Released 8:30 EST)
- Employment Cost Index ALLX (Released 8:30 EST)
- Initial Jobless Claims (Released 8:30 EST)
- Continuing Jobless Claims (Released 8:30 EST)
- Jobless Claims ALLX (Released 8:30 EST)
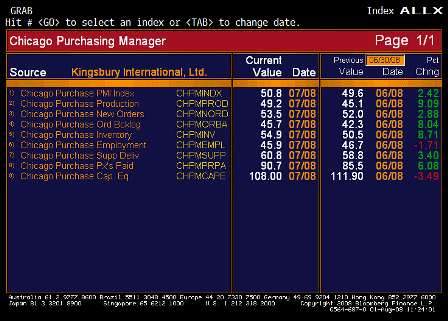
- Chicago Purchasing Manager (Released 9:45 EST)
- Chicago Purchasing Manager ALLX (Released 9:45 EST)
- NAPM-Milwaukee (Released 10:00 EST)
- NAPM-Milwaukee ALLX (Released 10:00 EST)
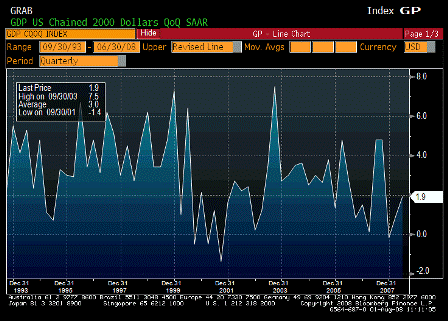
GDP QoQ Annualized (2Q A)
| Survey | 2.3% |
| Actual | 1.9% |
| Prior | 1.0% |
| Revised | 0.9% |
Less than expected, and helped by a low deflator, but up nonetheless with government and exports leading the charge.

GDP Price Index (2Q A)
| Survey | 2.4% |
| Actual | 1.1% |
| Prior | 2.7% |
| Revised | 2.6% |
big drop in the headline deflator – need to wait for next quarter to see if it’s reversed.
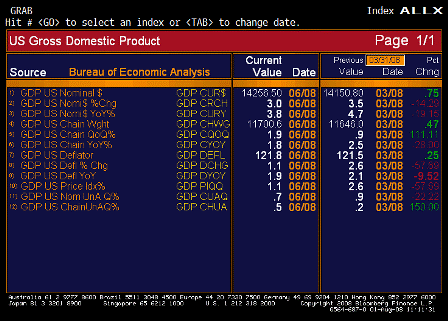
GDP ALLX (2Q A)
From Cesar:
GDP:
- grew 1.9% below expectations of 2.3%
- rebates helped consumption grow 1.5% for 1.08% contribution to growth
- net exports added 2.42% to growth
- inventories were drag of 1.92%
- residential investment was down -15.6% after declining 25.1% last month and the drag was “only” .62% after subtracting over 1% from GDP the last 3 quarters…
housing drag on GDP will diminish as decline decelerates and housing shrinks as % of total GDP
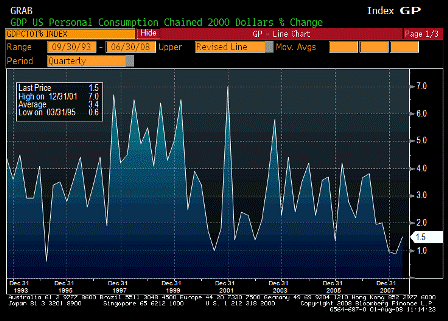
Personal Consumption (2Q A)
| Survey | 1.7% |
| Actual | 1.5% |
| Prior | 1.1% |
| Revised | 0.9% |
Less than expected but turning up.
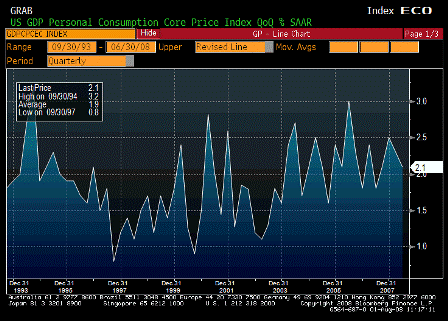
Core PCE QoQ (2Q A)
| Survey | 2.0% |
| Actual | 2.1% |
| Prior | 2.3% |
| Revised | n/a |
Worse than expected and still looks to be working its way higher over time.
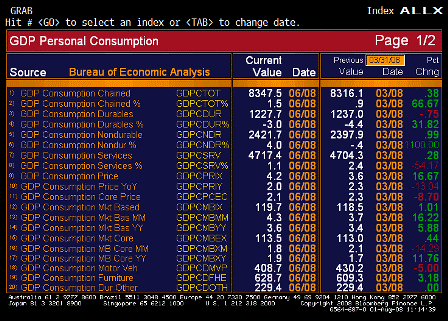
Personal Consumption ALLX 1 (2Q A)
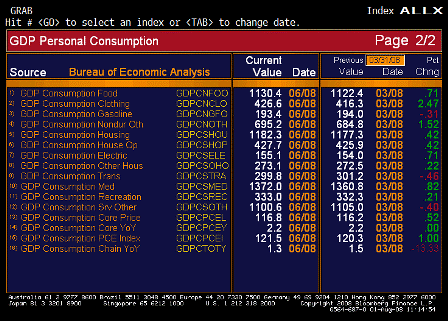
Personal Consumption ALLX 2 (2Q A)
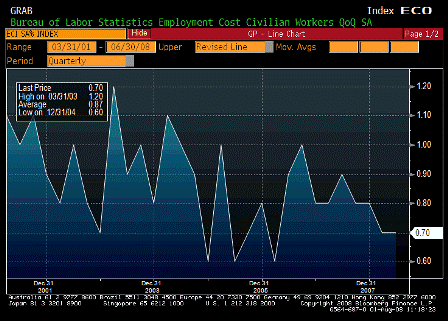
Employment Cost Index (2Q)
| Survey | 0.7% |
| Actual | 0.7% |
| Prior | 0.7% |
| Revised | n/a |
As expected
Look to import prices as an indication of foreign employment costs of what we consume. They are rising rapidly.
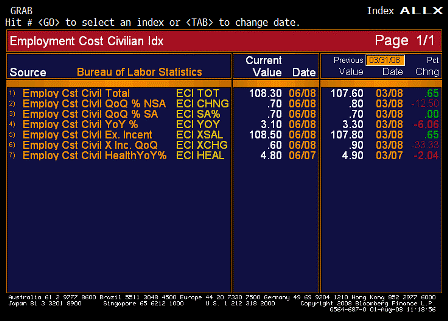
Employment Cost Index ALLX (2Q)
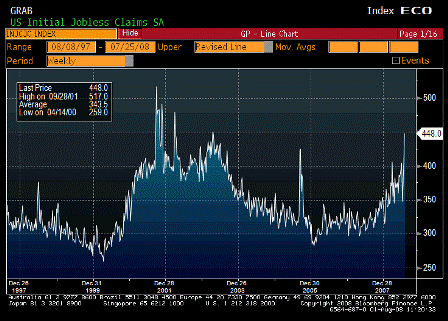
Initial Jobless Claims (Jul 26)
| Survey | 393K |
| Actual | 448K |
| Prior | 406K |
| Revised | 404K |
Higher than expected, and indicate next month might be a tougher job environment.
4 week average approaching 400,000.
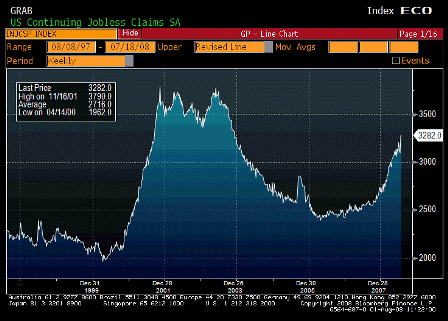
Continuing Jobless Claims (Jul 19)
| Survey | 3150K |
| Actual | 3282K |
| Prior | 3107K |
| Revised | 3097K |
Not looking good at all. No sign of retreat yet.
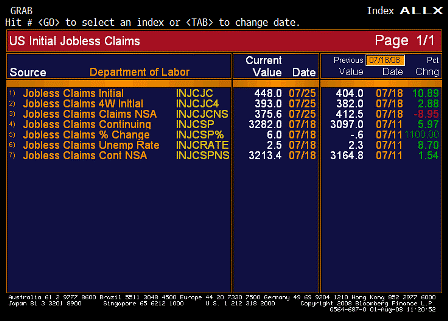
Jobless Claims ALLX (Jul 26)
From Cesar:
Initial and continuing claims:
jump to new cycle highs of 448k and 3,282k, respectively (no special factors noted)
the weakness in this real-time indicator seems to tell us more about current state of economy than today’s GDP reports or tomorrow’s payrolls…
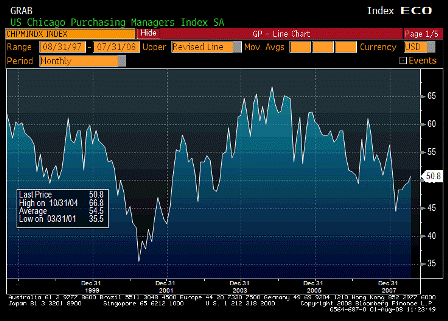
Chicago Purchasing Manager (Jul)
| Survey | 49.0 |
| Actual | 50.8 |
| Prior | 49.6 |
| Revised | n/a |
Higher than expected.
Prices paid remains very high.
Chicago Purchasing Manager ALLX (Jul)
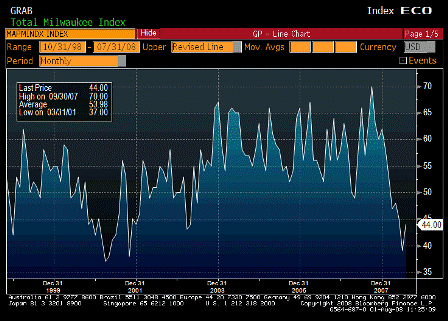
NAPM-Milwaukee (Jul)
| Survey | 43.5 |
| Actual | 44.0 |
| Prior | 39.0 |
| Revised | n/a |
Higher then expected.
Prices paid remain very high.
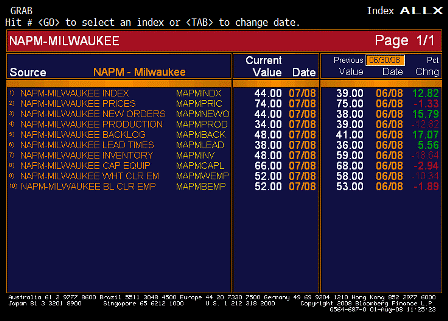
NAPM-Milwaukee ALLX (Jul)
[top]


