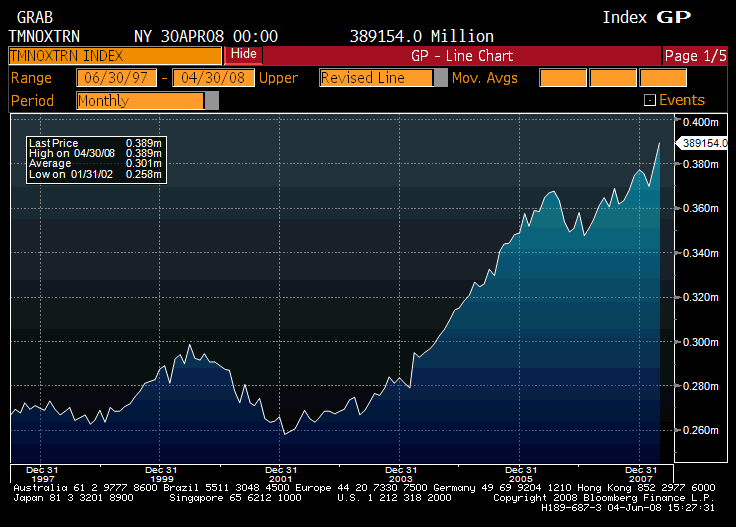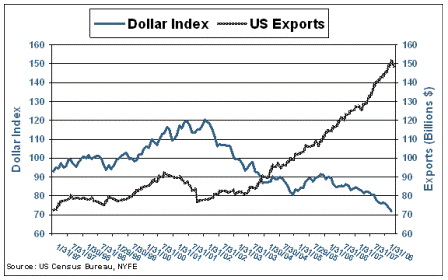
Dollar Index vs US Exports
Right – seems to me the dollar will fall until it’s at a level where the trade gap goes to about zero. So even though exports are way up and the trade gap down, there could be a lot more to go.
A nation can only run a trade deficit to the extent non-residents (governments and private sector agents) desire to net accumulate its financial assets (or buy its domestic assets such as real estate).
Seems to me Paulson, Bush, and Bernanke have successfully kept the world’s CBs, monetary authorities, and portfolio managers from actively accumulating USD financial assets.
Doesn’t seem like jawboning is going to alter foreign ‘savings desires’ apart from short term trading responses.
[top]