2008-05-07 US Economic Releases


[Skip to the end]


2008-05-07 MBAVPRCH Index

MBAVPRCH Index (May 2)

Survey n/a
Actual 381.3
Prior 340.1
Revised n/a

Seems to have at least stabilized.

[top] [end]


2008-05-07 MBAVREFI Index

MBAVREFI Index (May 2)

Survey n/a
Actual 2773.8
Prior 1905.2
Revised n/a

Doing okay.

[top][end]


2008-05-07 Nonfarm Productivity

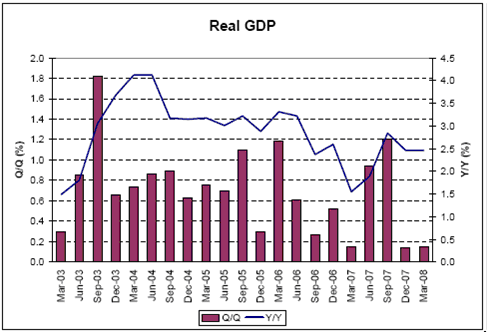
Nonfarm Productivity (1Q P)

Survey 1.5%
Actual 2.2%
Prior 1.9%
Revised 1.8%

Better than expected. Usually rises with output.

[top][end]


2008-05-07 Unit Labor Costs

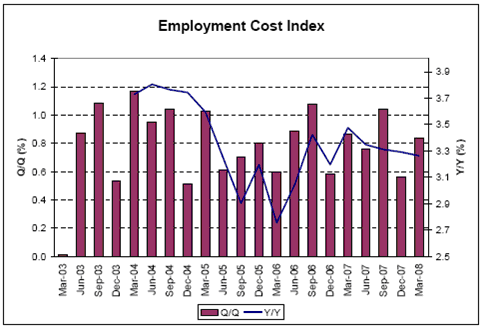
Unit Labor Costs (1Q P)

Survey 2.6%
Actual 2.2%
Prior 2.6%
Revised 2.8%

Better then expected, prior revised up. This series isn’t doing much.

Look to imports from China for a handle on unit labor costs as well.

[top][end]


2008-05-07 Pending Home Sales MoM

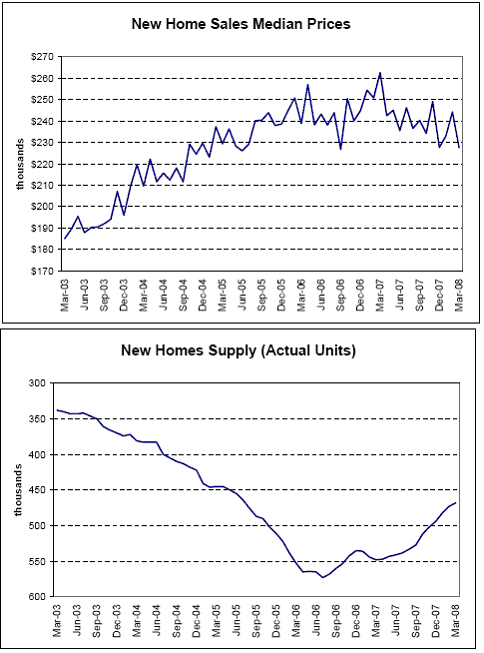
Pending Home Sales MoM (Mar)

Survey -1.0%
Actual -1.0%
Prior -1.9%
Revised -2.8%

Still falling some, seasonally adjusted, and with actual inventory going down there is less to buy.

[top][end]


2008-05-07 Consumer Credit

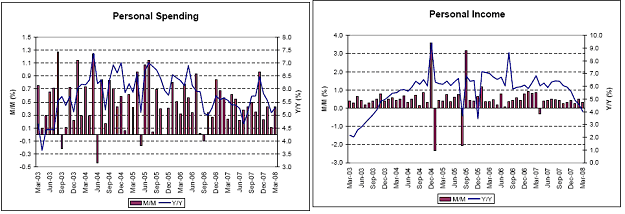
Consumer Credit (Mar)

Survey $6.0B
Actual $15.3B
Prior $5.2B
Revised $6.5B

Volatile series.
Seems to be holding up as incomes hold up.

[top]

Reuters: Redbook sales

TABLE-US chain store sales rose 1.4 pct last wk-Redbook

Muddling through at modestly positive numbers.

(Reuters) Redbook Research on Tuesday released the following seasonally adjusted weekly data on U.S. chain store sales:

Year-over-year: Week (w/e 5/3/08 vs year ago)         1.4 pct
Year-over-year:Month (April 2008 vs April 2007)       1.6 pct
Month-over-month: (April 2008 vs March 2008)         -1.6 pct

The Johnson Redbook Retail Sales Index is a sales-weighted index of year-over-year same-store sales growth in a sample of large U.S. general merchandise retailers representing about 9,000 stores.

Reuters: ICSC chain store sales

TABLE-US chain store sales fell 0.2 pct last week-ICSC

Tue May 6, 2008 7:45am EDT


NEW YORK, May 6 (Reuters) – The International Council ofShopping Centers and UBS Securities on Tuesday released the following seasonally adjusted weekly data on U.S. chain store retail sales.

WEEK ENDING INDEX 1977=100 YEAR/YEAR CHANGE (%) WEEKLY CHANGE (%)
May 3 495.4 2.3 -0.2
April 26 496.3 1.9 0.9
April 19 491.8 1.4 -0.7
April 12 495.3 1.8 0.9

The ICSC-UBS weekly U.S. retail chain store sales index is ajoint publication between ICSC and UBS Securities LLC. It measures nominal same-store sales, excluding restaurant and vehicle demand, and represents about 75 retail chain stores.

Muddling through like most export economies.

Year over year looks okay.

Re: Loan_Survey

(an interoffice email)


A few observations:

1) when chart 1 peaked in 5/01, we still had six months of recession to deal
with and the Fed didn’t stop cutting until 12/01 at 1.75%.
2) data only goes back to 1990, but the 5/90 peak was BEFORE the recession even
started, it didn’t end until 3/91 and the Fed didn’t stop cutting until 8/92 @
3%.
3) EDM9 has two + hikes priced in (three at the recent lows).  the EDZ8 thru
EDU9 part of the eurodollar curve seems awfully cheap to me.
*FED REPORTS NEAR-RECORD PACE OF BANKS TIGHTENING LOAN TERMS
*FED SAYS CONSUMER, BUSINESS LOANS WEAKER FOR PAST THREE MONTHS
*FED SAYS 55% OF BANKS TOUGHENED BUSINESS LENDING SINCE JANUARY
*FED SURVEY GAUGES LENDING POLICY BY 56 U.S., 21 OVERSEAS BANKS
*FED SAYS DEMAND MORE RESTRAINED FOR CONSUMER, BUSINESS LOANS
*FED SENIOR LOAN OFFICERS SURVEY COVERS PAST THREE MONTHS

==============================================================================
April   Jan.   Oct.   July  April   Jan.   Oct.   July
2008   2008   2007   2007   2007   2007   2006   2006
===============================================================================
——————Percentage of Total——————
Large & mid-market      100.0% 100.0% 100.0% 100.0% 100.0% 100.0% 100.0% 100.0%
Tightened considerably   3.6%   1.8%   1.9%   0.0%   0.0%   0.0%   0.0%   0.0%
Tightened somewhat      51.8%  30.4%  17.3%   9.4%   3.8%   5.3%   7.4%   5.4%
Basically unchanged     44.6%  67.9%  80.8%  88.7%  88.7%  89.5%  85.2%  80.4%
Eased somewhat           0.0%   0.0%   0.0%   1.9%   7.5%   5.3%   7.4%  14.3%
Eased considerably       0.0%   0.0%   0.0%   0.0%   0.0%   0.0%   0.0%   0.0%
——————–Number of Banks——————–
Large & mid-market          56     56     52     53     53     57     54     56
Tightened considerably      2      1      1      0      0      0      0      0
Tightened somewhat         29     17      9      5      2      3      4      3
Basically unchanged        25     38     42     47     47     51     46     45
Eased somewhat              0      0      0      1      4      3      4      8
Eased considerably          0      0      0      0      0      0      0      0
===============================================================================
NOTE: Large and middle-market firms are those with annual sales of $50 million
or more.

SOURCE: Federal Reserve  FRBA <GO>

Thanks,

Don’t forget to add ‘and the economy is improving’ with GDP looking a lot like it bottomed in Q4.

With fiscal adding a quick $170 billion or so of net financial assets/spending power to demand over the next few months watch for additional price pressures across the board.

2008-05-05 US Economic Releases


[Skip to the end]


2008-05-05 ISM Non-Manufacturing Composite

ISM Non-Manufacturing Composite

Survey 49.1
Actual 52.0
Prior 49.6
Revised n/a

[top]

2008-05-05 ISM Manufacturing TABLE

ISM Manufacturing TABLE

Nice bounce back, above expectations, back above 50, but the chart still looks like it’s slowly working its way lower.
The table shows gains in employment to 50.8 from 46.9, and Prices Paid up to a 5 month high of 72.1

Twin themes intact: weakness (but no recession) and rising prices.

Crude just printed above $120, as Saudis remain firmly in control.


[top]

Bloomberg: US First Quarter Advance GDP: Statistical Summary


[Skip to the end]

U.S. First Quarter Advance GDP: Statistical Summary (Table)

by Kristy Scheuble

(Bloomberg) Following is a summary of Gross Domestic Product from the Commerce Department.


  1Q 4Q 3Q 2Q 1Q 4Q 3Q
  2008 2007 2007 2007 2007 2006 2006

Annualized Quarterly Change

Real GDP 0.6% 0.6% 4.9% 3.8% 0.6% 2.1% 1.1%
YOY percent 2.5% 2.5% 2.8% 1.9% 1.5% 2.6% 2.4%

Year over year looks fine.

Personal consumption 1.0% 2.3% 2.8% 1.4% 3.7% 3.9% 2.8%

Down, but holding positive as income continues to grow.

Durable goods -6.1% 2.0% 4.5% 1.7% 8.8% 3.9% 5.6%
Nondurable goods -1.3% 1.2% 2.2% -0.5% 3.0% 4.3% 3.2%
Services 3.4% 2.8% 2.8% 2.3% 3.1% 3.7% 2.0%

Services picking up the slack from goods.

Gross private investment -4.7% -14.6% 5.0% 4.6% -8.2% -14.1% -4.1%
Fixed investment -9.7% -4.0% -0.7% 3.2% -4.4% -7.1% -4.7%
Nonresidential -2.5% 6.0% 9.3% 11.0% 2.1% -1.4% 5.1%
Structures -6.2% 12.4% 16.4% 26.2% 6.4% 7.4% 10.8%
Equipment & software -0.7% 3.1% 6.2% 4.7% 0.3% -4.9% 2.9%
Residential -26.7% -25.2% -20.5% -11.8% -16.3% -17.2% -20.4%

Housing still subtracting quite a bit, has to taper off as it bottoms albeit at very low levels.

  1Q 4Q 3Q 2Q 1Q 4Q 3Q
  2008 2007 2007 2007 2007 2006 2006
Exports 5.5% 6.5% 19.1% 7.5% 1.1% 14.3% 5.7%
Goods 5.2% 3.9% 26.2% 6.6% 0.9% 9.6% 7.4%
Services 6.1% 13.2% 4.0% 9.6% 1.6% 26.0% 2.0%

March trade report could revise exports much higher…

Imports 2.5% -1.4% 4.4% -2.7% 3.9% 1.6% 5.4%
Goods 2.4% -2.6% 4.8% -2.9% 4.2% -0.6% 6.2%
Services 3.5% 5.5% 1.7% -1.7% 2.3% 14.2% 1.3%

and imports lower.

Government consumption 2.0% 2.0% 3.8% 4.1% -0.5% 3.5% 0.8%
Federal 4.6% 0.5% 7.1% 6.0% -6.3% 7.3% 0.9%
National defense 6.0% -0.5% 10.1% 8.5% -10.8% 16.9% -1.5%
Nondefense 1.8% 2.8% 1.1% 0.9% 3.8% -10.0% 6.0%

Federal government spending deferred from 2007 kicking in, especially defense..

State and local 0.5% 2.8% 1.9% 3.0% 3.0% 1.3% 0.7%

As state and local growth slows.

Other Measures

Change in inventories $B $1.8 -$18.3 $30.6 $5.8 $0.1 $17.4 $53.9
Net exports $B -$496 -$503 -$533 -$574 -$612 -$597 -$634
Real final sales -0.2% 2.4% 4.0% 3.6% 1.3% 3.5% 1.0%
Gross domestic purchases 0.4% -0.4% 3.3% 2.4% 1.1% 0.8% 1.3%
Final sales to dom purch -0.4% 1.3% 2.5% 2.1% 1.7% 2.1% 1.2%

Contribution to Change in GDP

Real GDP 0.6% 0.6% 4.9% 3.8% 0.6% 2.1% 1.1%

If revised up with March trade numbers, Q4 would have been the bottom.

Personal consumption 0.68% 1.58% 2.01% 1.00% 2.56% 2.68% 1.88%
Durables -0.48% 0.15% 0.35% 0.14% 0.67% 0.30% 0.43%
Motor Vehicle -0.37% 0.09% -0.17% -0.10% 0.35% 0.00% 0.16%
Nondurables -0.27% 0.25% 0.46% -0.10% 0.61% 0.86% 0.64%
Services 1.43% 1.18% 1.20% 0.96% 1.28% 1.52% 0.81%
Housing 0.23% 0.34% 0.27% 0.29% 0.26% 0.20% 0.18%

Again, services picking up the slack.

Gross pvt dom invest -0.70% -2.40% 0.77% 0.71% -1.36% -2.50% -0.70%
Fixed investment -1.50% -0.62% -0.11% 0.49% -0.70% -1.19% -0.80%
Nonresidential -0.28% 0.63% 0.96% 1.12% 0.22% -0.15% 0.53%
Structures -0.23% 0.41% 0.52% 0.78% 0.20% 0.23% 0.31%
Equipment & software -0.05% 0.22% 0.44% 0.34% 0.02% -0.38% 0.21%
Info processing 0.23% 0.51% 0.24% 0.36% 0.56% -0.06% 0.24%
Computers 0.12% 0.20% 0.08% 0.08% 0.25% 0.03% 0.09%
Software 0.13% 0.18% 0.07% 0.16% 0.14% 0.04% 0.05%
Residential -1.23% -1.25% -1.08% -0.62% -0.93% -1.04% -1.33%

Soft quarter for investment at least partially due to the widespread recession psychology.

  1Q 4Q 3Q 2Q 1Q 4Q 3Q
  2008 2007 2007 2007 2007 2006 2006
Change in inventories 0.81% -1.79% 0.89% 0.22% -0.65% -1.31% 0.10%
Nonfarm 0.93% -1.69% 0.87% 0.27% -0.69% -1.56% 0.01%
Net exports 0.22% 1.02% 1.38% 1.32% -0.51% 1.25% -0.25%
Exports 0.67% 0.77% 2.10% 0.85% 0.13% 1.51% 0.62%
Goods 0.45% 0.33% 1.96% 0.53% 0.07% 0.73% 0.56%
Services 0.22% 0.45% 0.14% 0.33% 0.05% 0.78% 0.07%
Imports -0.44% 0.24% -0.72% 0.47% -0.63% -0.26% -0.88%
Goods -0.35% 0.39% -0.67% 0.42% -0.57% 0.09% -0.84%
Services -0.09% -0.15% -0.05% 0.05% -0.06% -0.35% -0.03%
Govt. consumption 0.39% 0.38% 0.74% 0.79% -0.09% 0.66% 0.14%
Federal 0.32% 0.04% 0.50% 0.41% -0.46% 0.50% 0.06%
National defense 0.28% -0.03% 0.47% 0.39% -0.54% 0.74% -0.07%
Nondefense 0.04% 0.06% 0.03% 0.02% 0.08% -0.24% 0.14%
State and local 0.07% 0.34% 0.24% 0.37% 0.36% 0.16% 0.08%

Implicit Price Deflators

GDP 2.6% 2.4% 1.0% 2.6% 4.2% 1.7% 2.4%

And higher numbers are in the pipeline as per the PPI and CPI reports.

Gross domestic purchases 3.5% 3.7% 1.7% 3.8% 3.8% 0.1% 2.5%

Not bad.

  1Q 4Q 3Q 2Q 1Q 4Q 3Q
  2008 2007 2007 2007 2007 2006 2006

Price Indexes

GDP 2.6% 2.4% 1.0% 2.6% 4.2% 1.7% 2.4%
YOY percent 2.2% 2.6% 2.4% 2.7% 2.9% 2.7% 3.2%
Personal consumption 3.5% 3.9% 1.8% 4.3% 3.5% -0.9% 2.6%
YOY percent 3.4% 3.4% 2.1% 2.3% 2.3% 1.9% 2.9%

Moving up.

ex food and energy 2.2% 2.5% 2.0% 1.4% 2.4% 1.9% 2.3%
Real final sales 2.7% 2.4% 1.0% 2.7% 4.2% 1.7% 2.3%

Moving up.

Gross domestic purchases 3.5% 3.7% 1.8% 3.8% 3.8% 0.1% 2.5%

Unannualized Quarterly Change

Current GDP 0.8% 0.7% 1.5% 1.6% 1.2% 0.9% 0.9%
Real GDP 0.1% 0.1% 1.2% 0.9% 0.2% 0.5% 0.3%

Seen a lot worse..

Weakness but no recession and even some improvement on the horizon as government and exports pick up the slack from housing and the financial sector.

Employment softer but still reasonably firm by mainstream standards with unemployment at 5%.

Prices continue firm as Saudis continue to hike crude prices, even as other commodities settle down some.

Hence, I see a narrowing output gap and higher prices on the horizon, and Fed rate hikes at least as aggressive as currently priced by the FF futures market.


[top]

2008-05-03 Weekend update (in brief)


[Skip to the end]

2008-05-03 Real GDP

No recession here, and Q1 likely to be revised higher when March trade numbers come out.

Q3 could be 2% depending on the multiplier from the fiscal package, and by Q3 other government spending will be kicking in for the elections and housing is unlikely to be subtracting from GDP. It could even be adding by then.

As suspected, the current weak housing market has been offset by strong exports.

Financial sector losses have nothing to do with GDP unless they somehow reduce aggregate demand.

The prime suspect was the credit channel, but so far the evidence shows only limited damage due to tighter credit conditions, and not the downward spiral feared by the Fed and many other private economists.

2008-05-03 Capacity Utilization, ISM Manufacturing

On the soft side, but no recession.

2008-05-03 Personal Spending, Personal Income

The consumer is muddling through as best as can be expected in an export economy.

2008-05-03 New Home Sales Median Prices, New Home Suppy (Actual Units)

Median prices are soft and may or may not have bottomed, as actual inventories have worked their way down to relatively normal levels for a relatively normal sales pace (which we don’t have yet).

2008-05-03 NAHB Housing Index, NAHB Present Sales Index, NAHB Future Sales Index, Conference Board Home Buying Intentions

The bulk of the adjustment may have been bottoming around October/November.

2008-05-03 Housing Starts, Building Permits

Low starts have reduced supply as builders and buyers remain cautious.

2008-05-03 Government Spending, Government Revenue

Government spending is roaring back and added nicely to Q1 GDP (March print above has timing issues and wasn’t functionally as low as indicated).

Revenue also holding up, indicating no recession yet.

2008-05-03 Export Prices, U. of Michigan 12 Month Inflation Expectations

Every price chart is looking higher, and expectations have elevated, and the Fed keeps cutting rates. Who would’ve thought?

Fisher and Plosser make the mainstream case and are outvoted.

2008-05-03 Employment Cost Index

Wages remain ‘well contained’.

(If you don’t count import prices from China..)

2008-05-03 Import Prices ex. Petro

Globalization is now inflationary.

2008-05-03 U. of Michigan Confidence

All the confidence surveys look about this weak, and at recession type levels, and about 90% of voters think we are in a recession.

American’s aren’t used to an export economy with declining real terms of trade – a mercantilist concept publicly supported by Bernanke and Paulson.

And they don’t seem to like it.


[top]

2008-05-02 US Economic Releases


[Skip to the end]


2008-05-02 Change in Nonfarm Payrolls

Change in Nonfarm Payrolls (Apr)

Survey -75K
Actual -20K
Prior -80K
Revised -81K

Upside surprise – staying above recession levels, and a lagging indicator.

[top]


2008-05-02 Unemployment Rate

Unemployment Rate (Apr)

Survey 5.2%
Actual 5.0%
Prior 5.1%
Revised n/a

Still trending higher, but not at recession levels, and a lagging indicator as well.

And still very near what the fed considers full employment, putting inflation expectations at risk of elevating for the mainstream.

[top]


2008-05-02 Change in Manufacturing Payrolls

Change in Manufacturing Payrolls (Apr)

Survey -35K
Actual -46K
Prior -48K
Revised n/a

Better than expected, not at recession levels.

[top]


2008-05-02 Average Hourly Earnings MoM

Average Hourly Earnings MoM (Apr)

Survey 0.3%
Actual 0.1%
Prior 0.3%
Revised n/a

Lower than expected, indicating wages still well anchored, at least in this report.

[top]


2008-05-02 Average Hourly Earnings YoY

Average Hourly Earnings YoY (Apr)

Survey 3.6%
Actual 3.4%
Prior 3.6%
Revised n/a

Coming off some but still moving up at a reasonably pace.

[top]


2008-05-02 Average Weekly Hours

Average Weekly Hours (Apr)

Survey 33.7
Actual 33.7
Prior 33.8
Revised n/a

[top]


2008-05-02 Factory Orders

Factory Orders (Mar)

Survey 0.2%
Actual 1.4%
Prior -1.3%
Revised -0.9%

[top]


2008-05-02 Factory Orders TABLE

Factory Orders TABLE

Upside suprise, same story – domestic weak, export sector strong.

[top]

Re: Federal Reserve Announcement

(an email exchange)

On Fri, May 2, 2008 at 9:44 AM, Jeff wrote:

The Fed announced today that, starting May 5th, it was expanding its cash-loan biweekly auctions for banks (Term Auction Facility or TAF) by 50% to $75 billion each auction.  This was the third increase in the four months the program has existed.  The Fed also expanded the collateral accepted for the US Treasuries to include other AAA private-label mbs securities,

good, it should be open to any member bank assets- they are all occ legal anyway

in addition to the residential and commercial mbs and agency CMOs that it already accepts.  It also increased its currency swap facility with the ECB to $50 billion and with the Swiss National Bank to $12 billion and extended the terms through January 2009. 

interesting that the ECB needs more dollars.  if there is going to be a systemic failure it’s in the eurozone.