2008-05-27 US Economic Releases


[Skip to the end]


2008-05-27 S&P-CaseShiller Home Price Index

S&P/CaseShiller Home Price Index (Mar)

Survey n/a
Actual 172.2
Prior 175.9
Revised 176.0

Still moving lower. The sample is the 20 largest metro areas which were the regions hit hardest by the speculative bulge.

Broader measures don’t show this kind of depreciation.

[top][end]


2008-05-27 S&P-CS Composite-20 YoY

S&P/CS Composite-20 YoY (Mar)

Survey -14.2%
Actual -14.4%
Prior -12.7%
Revised n/a

Same as above.

[top][end]


2008-05-27 S&P-CS US HPI

S&P/Case-Shiller US HPI (1Q)

Survey n/a
Actual 159.2
Prior 170.6
Revised 170.6

Same as above.

[top][end]


2008-05-27 S&P-CS US HPI YoY%

S&P/Case-Shiller US HPI YoY% (1Q)

Survey n/a
Actual -14.1%
Prior -8.9%
Revised n/a

Same as above.

[top][end]


2008-05-27 New Home Sales

New Home Sales (Apr)

Survey 520K
Actual 526K
Prior 526K
Revised 509K

April up and higher than expected, March revised down some.

[top][end]


2008-05-27 New Home Sales MoM

New Home Sales MoM (Apr)

Survey -1.1%
Actual 3.3%
Prior -8.5%
Revised -11.0%

As above.
[top][end]


2008-05-27 Consumer Confidence

Consumer Confidence (May)

Survey 60.0
Actual 57.2
Prior 62.3
Revised 62.8

This is what an export economy looks like.

[top][end]


2008-05-27 Richmond Fed Manufacturing Index

Richmond Fed Manufacturing Index (May)

Survey 1
Actual -3
Prior 0
Revised n/a

[comments]

[top][end]


2008-05-27 ABC Consumer Confidence

ABC Consumer Confidence (May 25)

Survey -49
Actual -51
Prior -49
Revised n/a

As above. Consumers are getting squeezed by inflation, while exports boom.

[top]

Data Review

thanks, a few quips below:

Karim writes:

  • Conference Board survey falls from 62.8 to 57.2 (lowest since 1992)
  • Both present situation and expectations decline

Labor conditions, plans to buy home and plans to buy auto all fall to new cycle lows

Tough living in an export economy.

  • 1yr inflation expectations jump from 6.8 to 7.7

Inflation rips as non-residents outbid us for your output, as all our funds are spent on food and fuel.

  • Case Shiller Home price index accelerates rate of decline, down 6.7% q/q and 14.1% y/y

Narrow index of 20 metro regions, with 4 or 5 biggest spec boom/bust regions doing most of the damage.

  • New home sales rise 3.3% in April; mths inventories fall from 11.1 to 10.6

Coming back from unsustainably low levels give the US population and income growth.

Actual homes in inventory fell to the lowest levels since July.

  • Jan-March sales data revised lower by cumulative 5.5%

Tough first quarter with record low consumer sediment :) behind us.

Mexico’s poor get food cash bonus

Right, this was also suggested in a prior email- the political response towards a food shortage would be cash distributions.
Assuming there actually is a world food shortage and the prices are indicative of a world market allocating by price, this doesn´t create any new food but simply adds upward pressure on prices, triggering an international inflation.

Politically, there is no other choice but to add to inflation like this to at least be seen to be doing something.

Mexico’s poor get food cash boost

The Mexican government is to give its poorest citizens a monthly cash payment of 120 pesos ($11.55; £5.85) to help them cope with rising food prices.

The news came a day after the country said it would cut tariffs on imported crops such as corn, wheat and rice.

In a further sign of the impact of rising food and fuel costs, inflation in Vietnam jumped to 25% in May, the highest rate for 10 years.
Average food costs have risen by 42.4% in a year, the Statistics Office said.

Growing demand
In Mexico, official figures show consumer prices rose by 4.55% – the fastest rate for three years – in the 12 months to 30 April, led by increases in the cost of tomatoes, chicken and cooking oil.

Growing demand from fast-expanding countries such as India and China has been blamed for spiralling food prices, along with record fuel costs and the use of grain to produce bio-fuels.

Governments around the world are under pressure to intervene to help the poorest cope with the sharp food price rises.

There have been public demonstrations about food prices in a number of countries including Egypt and South Africa.

Mexico’s monthly cash payment, which will go to 26 million people in the Latin American country, equates to just over twice the national daily minimum wage of 50 pesos.

The government faced street protests last year when the price of tortillas doubled.

Rice restrictions
Vietnam has seen the price of rice, its staple food, jump 67.8% in the last 12 months, according to government figures.

One of Vietnam’s most important sources of imported rice, Cambodia, stopped exporting the grain in March.

It is one of a number of rice-producing countries, including India, Egypt and Indonesia, to have either banned or restricted exports in recent months to secure supply for domestic customers.

On Tuesday, Cambodia was set to resume exports of rice after its two-month ban ended.

Prime Minister Hun Sen said only rice that was not needed for domestic consumption could be sold for overseas consumption until the new harvesting season began in December.

Last year, that amounted to 1.6 million tons of milled rice.

Bloomberg: New-Home Sales in the U.S. Rose 3.3% to 526,000 Pace

Looking more like a bottom with every report. And most housing reports are ‘fighting’ some strong seasonals in the spring.

by Shobhana Chandra

(Bloomberg) New-home sales in the U.S. unexpectedly rose in April after readings for the prior month were revised down, signaling a worsening housing slump is still a threat to the economy.

Sales increased 3.3 percent to an annual pace of 526,000 from a 509,000 rate the prior month that was the lowest in 17 years, the Commerce Department said today in Washington. A separate report today showed home prices dropped in the first quarter by the most in at least 20 years.

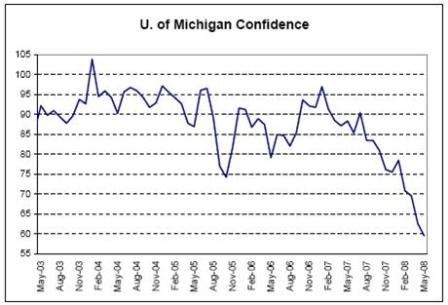
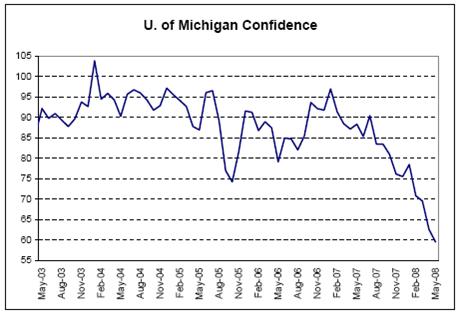
A separate report today showed confidence among American consumers fell to the lowest level since October 1992 this month, raising the risk that households will rein in spending. The Conference Board’s confidence index declined more than forecast to 57.2.

They already have reined it in. That´s what an export economy looks like!

Economists’ Forecasts
Economists forecast new home sales would drop to a 520,000 annual pace from an originally reported 526,000 rate the prior month, according to the median estimate in a Bloomberg survey of 70 economists. Forecasts ranged from 500,000 to 570,000.

Purchases in April were the second lowest since October 1991. The March reading became the weakest since April 1991.

The median sales price last month increased 1.5 percent from April 2007 to $246,100. The figures can be influenced by changes in the mix of sales at the regional level. For that reason, economists prefer price measures that track the same house over time.

They never added that type of comment when prices fell. Still a lot of biased reporting out there.

One such gauge is the S&P/Case-Shiller index. Those figures, also reported today, showed house prices dropped 14.1 in the first quarter compared with the same period in 2007, the biggest decline since records began in 1988.

Much narrower market and different months

Sales of new homes were down 42 percent from April 2007, the biggest year-over-year decline since September 1981, the Commerce report showed.

Better to be 10 miles from hel_ and moving away from it than 100 miles away moving towards it.

Drop in Inventories
One bright spot is that inventories decreased. The supply of homes at the current sales rate dropped to 10.6 months’ worth from 11.1 months in March. The number of homes completed and waiting to be sold decreased to 181,000, the fewest since July.

Shortages looming as suggested in prior emails.

Purchases rose in three of four regions, led by a 42 percent jump in the Northeast. They increased 8.3 percent in the West and 5.8 percent in the Midwest. Purchases dropped 2.4 percent in the South.

Sales of previously owned homes, which account for about 85 percent of the market, fell 1 percent in April, and the supply of unsold properties reached a record, the National Association of Realtors said last week.

New-home purchases, which make up the remaining 15 percent of the market, are considered a timelier indicator because they are based on contract signings. Resales are calculated when a contract closes, usually a month or two later.

2008-05-24 Valance Weekly Chart Review

2008-05-24 Real GDP

Hard to see any recession here, and the consensus is for Q1 to be revised up to 0.9%, bringing year over year up to 2.8%.

I also think the estimates of the effects of the fiscal package are on the low side.

2008-05-24 Personal Spending, Personal Income

Income and spending continue to chug along, ahead of core but not headline ‘inflation’.

2008-05-24 Total Delinquency Rate, Residential Delinquency Rate, All Consumer Loan Delinquency Rate, Credit Card Delinquency Rate

Still moving higher.

2008-05-24 Fiscal Balance, Government Public Debt, Government Spending, Government Revenue

Fiscal rebates now kicking, with other government spending on the rise as well – should be a decent Q2 and better Q3.

And revenues seems to be holding up also indicating no recession yet.

2008-05-24 Export Prices, U. of Michigan 12 Month Inflation Expectations, CRB Index, Saudi Crude Production

2008-05-24 Philly Fed Prices Paid, Philly Prices Received

While headline CPI took a slight breather due to seasonal factors, the drivers of the current bout of inflation continue without let up, as crude oil touches $135 and the USD fall resumes.

Saudi crude output remains above 9 million bpd, indicating world demand is holding at the higher prices.

Booming exports and export prices work in tandem.

Inflation expectations have alarmed the FOMC with recent speeches indicating there will probably be no more rate cuts if inflation continues to escalate .

2008-05-24 U. of Michigan Confidence

2008-05-23 US Economic Releases


[Skip to the end]


2008-05-23 Existing Home Sales

Existing Home Sales (Apr)

Survey 4.85M
Actual 4.89M
Prior 4.93M
Revised 4.94M

Looking more and more like a bottoming action.

[top][end]


2008-05-23 Existing Home Sales MoM

Existing Home Sales MoM (Apr)

Survey -1.6%
Actual -1.0%
Prior -2.0%
Revised -1.8%

A touch better than expected for both March and April.


[top]

5 year tips 5 years forward and recent Fed speeches


[Skip to the end]

2008-05-22 5yr Tips 5yr Forward

5yr Tips 5yr Forward

The Fed watches this carefully in regard to inflation expectations, along with surveys and professional forecasts which have gone up considerably.

The 5 year tips 5 years forward dipped a couple of months ago on the generally commodity sell off, then fell again for short term technical reasons- the first five years went up with crude and the 10 year stayed about the same, so the forwards went down as a matter of arithmetic and little volume – and now this is all sorting itself out along the curve, with the forwards moving up as shown.

Just saw Fed Gov Warsh on TV saying the same thing Vice Chair Kohn said (and was also in the Fed minutes) they have to be careful about perceptions that the Fed’s inflation tolerance have gone up feeding into inflation expectations.

And concern has been further supported by pronouncements that even if the economy weakens some there’s no room for rate cuts.


[top]