(an interoffice email)
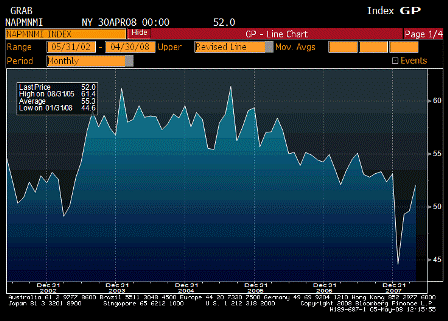
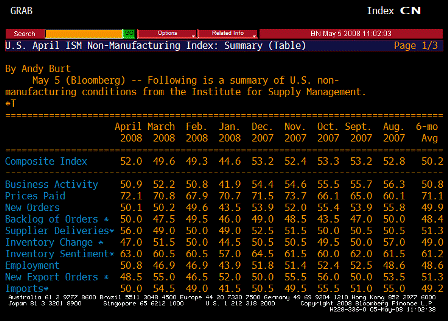
A few observations:1) when chart 1 peaked in 5/01, we still had six months of recession to deal
with and the Fed didn’t stop cutting until 12/01 at 1.75%.
2) data only goes back to 1990, but the 5/90 peak was BEFORE the recession even
started, it didn’t end until 3/91 and the Fed didn’t stop cutting until 8/92 @
3%.
3) EDM9 has two + hikes priced in (three at the recent lows). the EDZ8 thru
EDU9 part of the eurodollar curve seems awfully cheap to me.
*FED REPORTS NEAR-RECORD PACE OF BANKS TIGHTENING LOAN TERMS
*FED SAYS CONSUMER, BUSINESS LOANS WEAKER FOR PAST THREE MONTHS
*FED SAYS 55% OF BANKS TOUGHENED BUSINESS LENDING SINCE JANUARY
*FED SURVEY GAUGES LENDING POLICY BY 56 U.S., 21 OVERSEAS BANKS
*FED SAYS DEMAND MORE RESTRAINED FOR CONSUMER, BUSINESS LOANS
*FED SENIOR LOAN OFFICERS SURVEY COVERS PAST THREE MONTHS==============================
============================== ==================
April  Jan.  Oct.  July April  Jan.  Oct.  July
2008  2008  2007  2007  2007  2007  2006  2006
============================================================ ===================
——————Percentage of Total——————
Large & mid-market     100.0% 100.0% 100.0% 100.0% 100.0% 100.0% 100.0% 100.0%
Tightened considerably  3.6%  1.8%  1.9%  0.0%  0.0%  0.0%  0.0%  0.0%
Tightened somewhat     51.8% 30.4% 17.3%  9.4%  3.8%  5.3%  7.4%  5.4%
Basically unchanged    44.6% 67.9% 80.8% 88.7% 88.7% 89.5% 85.2% 80.4%
Eased somewhat          0.0%  0.0%  0.0%  1.9%  7.5%  5.3%  7.4% 14.3%
Eased considerably      0.0%  0.0%  0.0%  0.0%  0.0%  0.0%  0.0%  0.0%
——————–Number of Banks——————–
Large & mid-market         56    56    52    53    53    57    54    56
Tightened considerably     2     1     1     0     0     0     0     0
Tightened somewhat        29    17     9     5     2     3     4     3
Basically unchanged       25    38    42    47    47    51    46    45
Eased somewhat             0     0     0     1     4     3     4     8
Eased considerably         0     0     0     0     0     0     0     0
============================================================ ===================
NOTE: Large and middle-market firms are those with annual sales of $50 million
or more.SOURCE: Federal Reserve FRBA <GO>
Thanks,
Don’t forget to add ‘and the economy is improving’ with GDP looking a lot like it bottomed in Q4.
With fiscal adding a quick $170 billion or so of net financial assets/spending power to demand over the next few months watch for additional price pressures across the board.


