FT: Japan’s Financial Services Minister Offers Advice for US

US can learn from Japan’s crisis

by Michiyo Nakamoto

(Financial Times) The US should inject public funds into its financial system, which is undergoing a worse crisis than that experienced by Japan during its non-performing loan crisis, according to Japan’s financial services minister.

“It is essential [for the US] to understand that given Japan’s lesson, public fund injection [into the financial sector] is unavoidable,” Yoshimi Watanabe told the Financial Times..

The blind leading the blind.

What turned Japan was 7%+ deficits particularly when you include fx purchases.

Same with the US in 2003.

It’s always fiscal that supports aggregate demand as a point of logic.

2008-03-21: Valance Chart Review

Twin themes continue: weakness and higher prices.

A substantial pickup in net government spending beginning late Q2 and continued strong exports should keep GDP in positive territory.

Saudis/Russians continue as swing producers and should continue to hike prices.

Pension funds are also continuing to increase allocations to passive commodities and non-US equities.

2008-03-21 Capacity Utilization, ISM Manufacturing

2008-03-21 Philly Fed, Chicago PMI, ISM Manufacturing

2008-03-21 Philly Fed Backlog, Chicago PMI Backlog, ISM Manufacturing Backlog

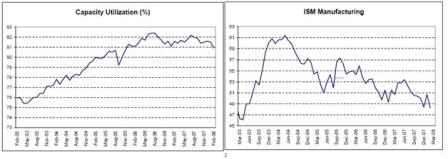
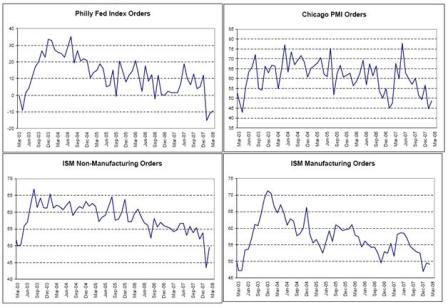
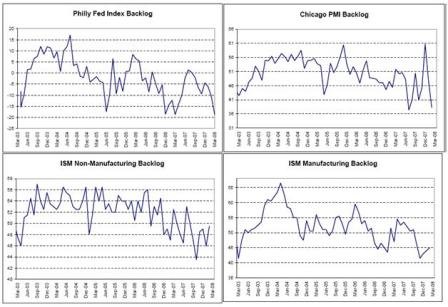
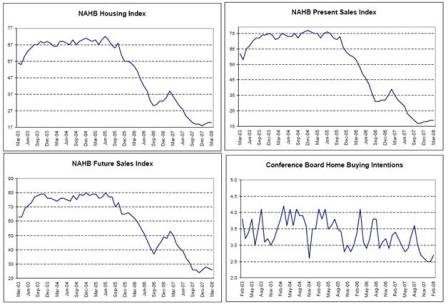
All the above charts together indicate a continued slowing of demand that took a blip down for the worse right around year end. There are some signs of a small bounce back, but the general downward bias remains.Rent levels for Q1 suggest real GDP growth is near zero, after growth of 0.6% in Q4.

Also, survey results have been known to reflect current psychology rather than actual results.


2008-03-21 Wholesale Inventories, Business Inventories

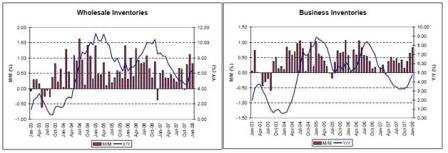
Business inventories have been kept reasonably low (not typical of past recessions).


2008-03-21 Retail Sales, Total Vehicle Sales, Redbook Retail Sales

2008-03-21 Personal Spending, Personal Income

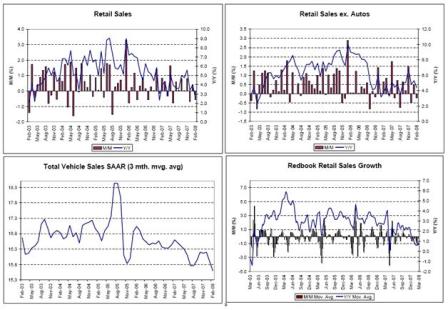
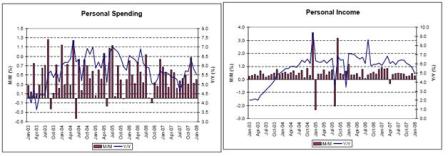
Retail sales have been decelerating over the last several months, though still up year over year.Personal income is a bit softer, though still growing and probably not softening as much as aggregate demand has softened and still sufficient to support nominal spending and nominal GDP growth.


2008-03-21 Non-farm Payrolls, Average Hourly Earnings, Average Weekly Hours, Unemployment Rate

2008-03-21 Total Hours Worked, Labor Participation Rate, Duration of Unemployment, Household Job Growth

2008-03-21 Initial & Continuing Claims

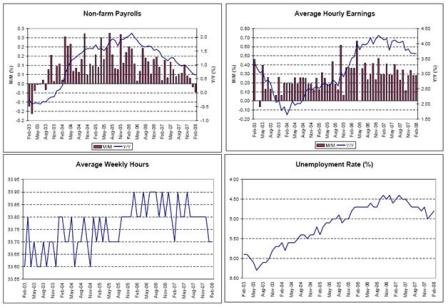
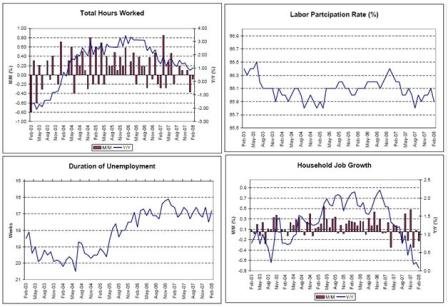
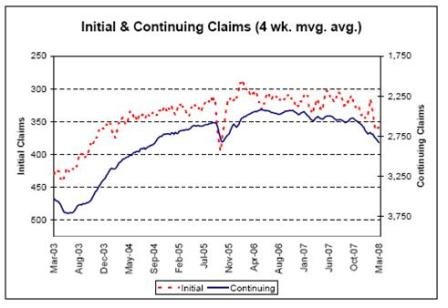
The labor data taken together tells the same story of a gradual decrease in demand since the middle of 2006, but not yet at previous recession levels.Also, the Fed expects the labor force participation rate to drift lower over time due to demographics.

This means employment growth is population limited, which limits non-inflationary GDP growth to something near productivity growth.

Also, the Fed considers 4.75% the non inflationary full employment level.

The current 4.8% unemployment rate is therefore very close to what the Fed considers to be full-employment.


2008-03-21 Durable Goods

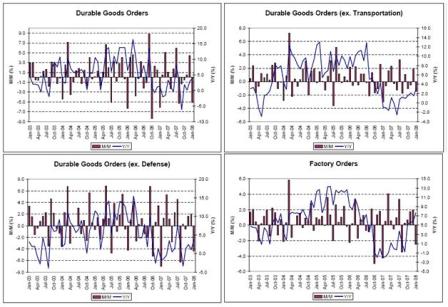
These look reasonably good, especially considering manufacturing has been in decline for a long time.Exports have been picking up the slack in demand from weak housing and weak consumer spending.


2008-03-21 NAHB, Conference Board Homebuying Intentions

2008-03-21 Housing Starts, Building Starts, Housing Affordability

2008-03-21 MBA Mortgage Applications, OFHEO Home Prices

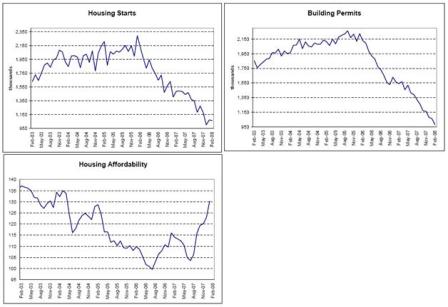
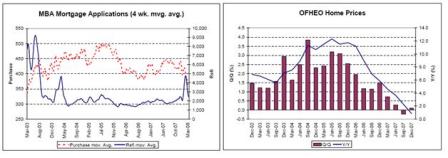
Housing has been the largest drag on GDP, subtracting about 1% for the last several quarters.Should it bottom at these historically very low levels it will stop subtracting from demand and begin to make a positive contribution.


2008-03-21 Fiscal Balance, Government Public Debt, Government Spending, Government Revenue

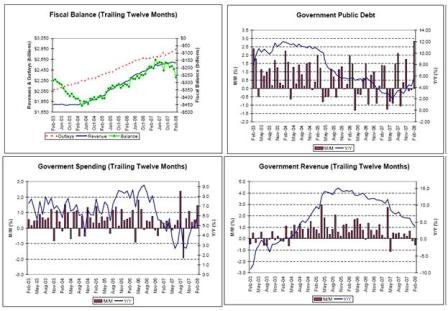
I expect net government spending to contribute perhaps an additional 2% to GDP vs 2007. The fiscal package will add about 1%, and it looks like 2007 spending may have been moved forward to 2008 as forecast increases in the deficit project additional net spending of 1%.


2008-03-21 Current Account Balance

2008-03-21 Trade Weighted Dollar

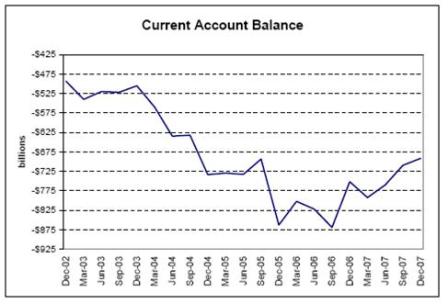
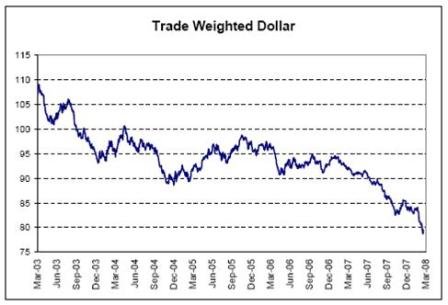
Exports have picked up much of the slack from housing and consumer spending, and look to be further accelerating as non-residents continue to desire to reduce their accumulation of USD financial assets.


2008-03-21 CPI, Core CPI

2008-03-21 PPI, Core PPI, Import Prices, Import Prices ex. Petro

2008-03-21 Export Prices, CRB Index, U. of Mich

2008-03-21 Empire Prices, Philly Fed Prices

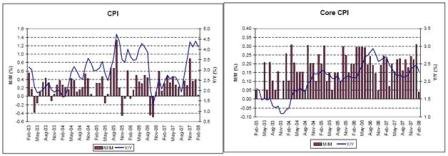
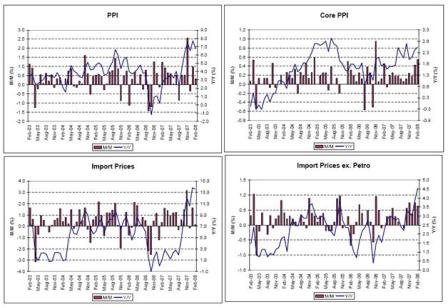
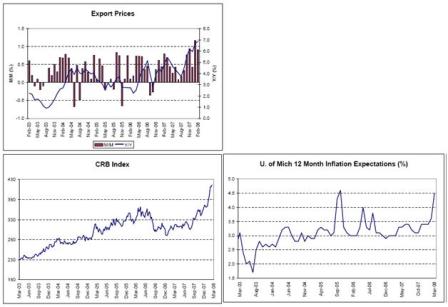
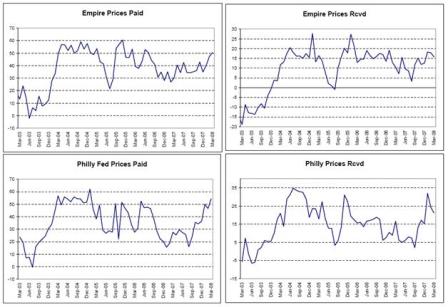
All this is sending prices up to rates not seen since the great inflation of the 1970’s, especially when taking into consideration the changes to measurement of the CPI and other indexes.


2008-03-21 ABC

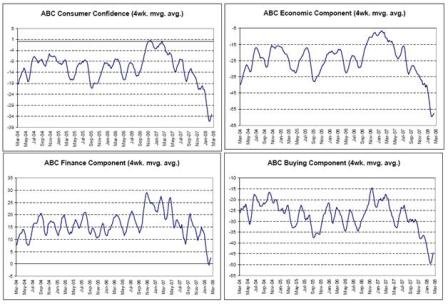
Confidence remains at the lows with a small blip up coinciding with slightly less bearish reporting from CNBC.


2008-03-21 Fed Funds Rate, 30Y Fixed Mortgage

2008-03-21 10Y Tips, Ratio of 10Y to 3M

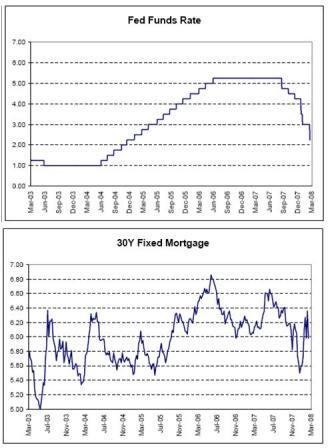
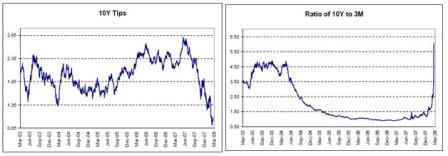
Even as the Fed cuts the Fed Funds rate, mortgage rates remain unchanged, and the yield curve steepens, as markets anticipate higher rates from the Fed down the road when they expect the Fed to turn to fighting inflation.The lower tips rates indicate markets expect the Fed to keep relatively low real rates for quite a while, even when fighting inflation.

2008-03-20 US Economic Releases

2008-03-20 Initial Jobless Claims

Initial Jobless Claims (Mar 15)

Survey 360K
Actual 378K
Prior 353K
Revised 356K

This has been trending higher but still not at recession levels.

(This series is not population adjusted so an upward drift over time is neutral.)

The American Axle strike also had some impact that will be reversed.


2008-03-0 Continuing Claims

Continuing Claims (Mar 8)

Survey 2840K
Actual 2865K
Prior 2835K
Revised 2833K

This series is also not at recession levels but is a lagging indicator.

It shows the job situation has been weakening since Q3.

This is what export economies tend to look like – labor markets always have a bit of slack, and domestic consumption is relatively low as the population works, gets paid, and can’t afford to consume its own output domestically, with the balance getting exported.

And GDP muddles through.


2008-03-20 Philadelphia Fed.

Philadelphia Fed. (Mar)

Survey -19.0
Actual -17.4
Prior -24.0
Revised n/a

2008-03-20 Philadelphia Fed. TABLE

Philadelphia Fed. TABLE

Better than forecast, some improvement, but still negative numbers.

For another rate cut, numbers have to come in worse than forecast.

Prices show continuing upward pressures. Fed needs these to level off.

Karim Basta:

  • Headline stays very weak at -17.4 (from -24)
  • Prices paid rises from 46.6 to 54.4 but Prices received drops from 24.3 to 21.2 (margin squeeze)
  • Employment drops from +2.5 to -4.7; emerging consensus of -50k drop in March payrolls
  • Workweek drops from -3.9 to -10
  • Special survey question on Q2 growth expectations: 0%

2008-03-20 Leading Indicators

Leading Indicators (Feb)

Survey -0.3%
Actual -0.3%
Prior -0.1%
Revised -0.4%

As expected, continuing weakness.

Stock market still the most reliable leading indicator.

Re: Credit recap

(an interoffice email)

>    On Thu, Mar 20, 2008 at 8:55 AM, John wrote:
>
>    The other thing about the IG widening is that the financial mess
>    has an outsized impact on the widening- so if you think we can
>    see the end of the tunnel on that, then IG likely to tighten.
>

I see the macro economy stabilizing and modest gdp growth returning as per previous consensus forecasts.

net govt spending increasing-

fiscal package

07 spending was moved forward to 08

total demand increase maybe 2% of gdp

foreign sector reducing the rate of accumulation of $US financial assets

US exports booming- up 16% + last month

trade gap still 58 billion, down from 70 billion, so the accumulation has gone down with rising exports, but there could be a long way to go

total net demand increase maybe 2% for 08

Pension fund ‘remonetizing’ by allocating to passive commodities could add another 1/2% to agg demand.

Total add to agg demand from those two sources are 4% of gdp. this should be plenty to support gdp at modest positive levels, and potentially a lot more.

Corporate earnings and cash flows still high, ex financial writeoffs.

Housing near 0 in my estimation, with no where to go but sideways or, more likely, up.

Actual quantities of physical housing inventories are down from the highs.

The govt. will ensure the agencies originate, hold, buy all available paper and support new lending to qualified buyers.

Employment is holding up pretty well. Unemployment history:

Nov: 4.7

Dec 5.0

jan 4.9

feb 4.8

Yes, it could move up a few tenths and be deemed a ‘disaster’ but it’s not the 1930’s 15% level, or the double digit levels of the 70’s, or 6% + seen in the 90’s

Over 30% of workers are paid directly or indirectly by gov and get headline cpi annual increases +.

Add pensioners and probably over half of income or more doesn’t ever go down. So the other half has to drop a lot just for the total to get to 0 nominal growth.

Same with consumer spending.

A negative gdp is likely to be a combination of rising nominal gdp but a higher deflator.

These are all minority positions. Psychology can’t get any worse- another bottoming condition.

I also see prices continuing to rise.

Saudis are price setter and it will take a swing of at least 5 million bpd of net world supply to dislodge them.

2008-03-19 US Economic Releases

2008-03-19 MBAVPRCH Index

MBAVPRCH Index (Mar 14)

Survey n/a
Actual 365.0
Prior 368.8
Revised n/a

Leveling off at 2003 levels, which corresponds to housing starts well over 1.5 million.

Also, this is a seasonally adjusted number, so as it stays level at current levels it corresponds to the typical spring increases in sales.

Still way above recession levels of the past, and mtg bankers have lost market share to the banks as well.


2008-03-19 MBAVREFI Index

MBAVREFI Index (Mar 14)

Survey n/a
Actual 2335.0
Prior 2448.2
Revised n/a

Refi activity remains moderate.

FOMC

Karim Basta:

  1. Further cut to gwth outlook
  2. Financial conditions tighter and housing getting worse
  3. Inflation receives greater concern than prior statement
  4. Conclusion: downside risks predominant and ‘timely’ means another intermeeting cut on the table.

Agreed, further comments below:

Release Date: March 18, 2008

For immediate release

The Federal Open Market Committee decided today to lower its target for the federal funds rate 75 basis points to 2-1/4 percent.

Could have been 100 as anticipated by the markets. Fed shaded its cut to the low side of the priced in expectations.

Recent information indicates that the outlook for economic activity has weakened further. Growth in consumer spending has slowed

Implies there is still some growth, not negative yet.

and labor markets have softened.

Looking unrevised February payroll number, not the lower unemployment rate. In January they looked at the higher unemployment rate. Unemployment has subsequently gone from 5.0% to 4.9% to 4.8% (rounded).

Financial markets remain under considerable stress,

They went a long way to relieve stress over the weekend.

and the tightening of credit conditions and the deepening of the housing contraction are likely to weigh on economic growth over the next few quarters.

Housing starts were revised up, and other indicators indicate it may have bottomed.

Inflation has been elevated, and some indicators of inflation expectations have risen.

This was noted in several Fed intermeeting speeches.

The Committee expects inflation to moderate in coming quarters, reflecting a projected leveling-out of energy and other commodity prices and an easing of pressures on resource utilization.

They continue to make this projection even after being completely wrong for many meetings.

Still, uncertainty about the inflation outlook has increased.

That’s why – their forecasts have proven unreliable, and crude/food continues to rise as the USD continues to fall.

It will be necessary to continue to monitor inflation developments carefully.

Only ‘monitor’? No action planned.

Today’s policy action, combined with those taken earlier, including measures to foster market liquidity, should help to promote moderate growth over time and to mitigate the risks to economic activity. However, downside risks to growth remain. The Committee will act in a timely manner as needed to promote sustainable economic growth and price stability.

Intermeeting action is on the table, for both growth and price stability.

Voting for the FOMC monetary policy action were: Ben S. Bernanke, Chairman; Timothy F. Geithner, Vice Chairman; Donald L. Kohn; Randall S. Kroszner; Frederic S. Mishkin; Sandra Pianalto; Gary H. Stern; and Kevin M. Warsh. Voting against were Richard W. Fisher and Charles I. Plosser, who preferred less aggressive action at this meeting.

Wonder how much less aggressive?

In a related action, the Board of Governors unanimously approved a 75-basis-point decrease in the discount rate to 2-1/2 percent. In taking this action, the Board approved the requests submitted by the Boards of Directors of the Federal Reserve Banks of Boston, New York, and San Francisco.

2008-03-18 US Economic Releases

2008-03-18 Producer Price Index MoM

Producer Price Index MoM (Feb)

Survey 0.4%
Actual 0.3%
Prior 1.0%
Revised n/a

2008-03-18 PPI Ex Food & Energy MoM

PPI Ex Food & Energy MoM (Feb)

Survey 0.2%
Actual 0.5%
Prior 0.4%
Revised n/a

2008-03-18 Producer Price Index YoY

Producer Price Index YoY (Feb)

Survey 6.8%
Actual 6.4%
Prior 7.4%
Revised n/a

2008-03-18 PPI Ex Food & Energy YoY

PPI Ex Food & Energy YoY (Feb)

Survey 2.1%
Actual 2.4%
Prior 2.3%
Revised n/a

Troubling as the Fed has indicated it’s getting passed through to core CPI measures.


2008-03-18 Housing Starts

Housing Starts (Feb)

Survey 995K
Actual 1065K
Prior 1012K
Revised 1071K

More indications of a possible bottom in housing, meaning it won’t be subtracting as much from GDP for the rest of the year.

Karim Basta:

Housing starts fall 0.6% in Feb, but January revised higher by 5.8%.

One notable trend is single vs multi-family starts. The latter has now risen for 3 straight months, whereas the former continues to decline across most regions. A couple explanations out there-foreclosures, real income weakness driving trend towards apartments/condos vs homes.

Permits fall another 7.8%; suggesting more declines in housing contribution to GDP going forward.

Margin squeeze evident in PPI as headline rises 0.3% and core by 0.5%.


2008-03-18 Building Permits

Building Permits (Feb)

Survey 1020K
Actual 978K
Prior 1048K
Revised 1061K

Looking down, but the prior revision might be more relevant.


2008-03-18 FOMC Rate Decision

FOMC Rate Decision (Mar 18)

Survey 2.25%
Actual 2.25%
Prior 3.00%
Revised n/a

2008-03-18 ABC Consumer Confidence

ABC Consumer Confidence (Mar 16)

Survey n/a
Actual -31
Prior -30
Revised n/a

Yet another chart that may have bottomed?