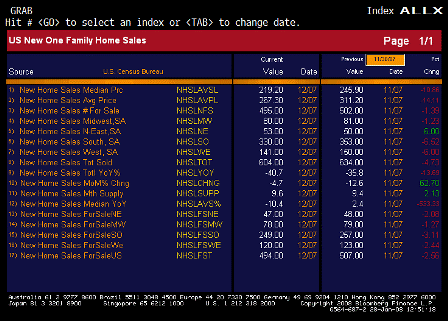
He’s got the data right, and I agree with all he concludes from it. All he’s missing is the difference he points two between now (unlimited funds available) and The Great Depression (banks short of lendable funds), including what the Fed presumably ‘did’ each time, are the differences between the constraints of the gold standard of that time vs today’s floating fx policy.
The Economy Is Fine (Really)
by Brian Wesbury
It is hard to imagine any time in history when such rampant pessimism about the economy has existed with so little evidence of serious trouble.
True, retail sales fell 0.4% in December and fourth-quarter real GDP probably grew at only a 1.5% annual rate. It is also true that in the past six months manufacturing production has been flat, new orders for durable goods have fallen at a 0.8% annual rate, and unemployment blipped up to 5%. Soft data for sure, but nowhere near the end of the world.
It is most likely that this recent weakness is a payback for previous strength. Real GDP surged at a 4.9% annual rate in the third quarter, while retail sales jumped 1.1% in November. A one-month drop in retail sales is not unusual. In each of the past five years, retail sales have reported at least three negative months. These declines are part of the normal volatility of the data, caused by wild swings in oil prices, seasonal adjustments, or weather. Over-reacting is a mistake.
A year ago, most economic data looked much worse than they do today. Industrial production fell 1.1% during the six months ending February 2007, while new orders for durable goods fell 3.9% at an annual rate during the six months ending in November 2006. Real GDP grew just 0.6% in the first quarter of 2007 and retail sales fell in January and again in April. But the economy came back and roared in the middle of the year — real GDP expanded 4.4% at an annual rate between April and September.
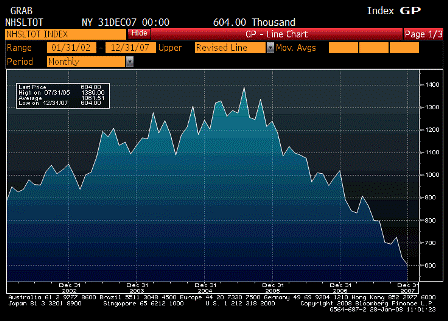
With housing so weak, the recent softness in production and durable goods orders is understandable. But housing is now a small share of GDP (4.5%). And it has fallen so much already that it is highly unlikely to drive the economy into recession all by itself. Exports are 12% of the economy, and are growing at a 13.6% rate. The boom in exports is overwhelming the loss from housing.
Personal income is up 6.1% during the year ending in November, while small-business income accelerated in October and November, during the height of the credit crisis. In fact, after subtracting income taxes, rent, mortgages, car leases and loans, debt service on credit cards and property taxes, incomes rose 3.9% faster than inflation in the year through September. Commercial paper issuance is rising again, as are mortgage applications.
Some large companies outside of finance and home building are reporting lower profits, but the over-reaction to very spotty negative news is astounding. For example, Intel’s earnings disappointed, creating a great deal of fear about technology. Lost in the pessimism is the fact that 20 out of 24 S&P 500 technology companies that have reported earnings so far have beaten Wall Street estimates.
Models based on recent monetary and tax policy suggest real GDP will grow at a 3% to 3.5% rate in 2008, while the probability of recession this year is 10%. This was true before recent rate cuts and stimulus packages. Now that the Fed has cut interest rates by 175 basis points, the odds of a huge surge in growth later in 2008 have grown. The biggest threat to the economy is still inflation, not recession.
Yet many believe that a recession has already begun because credit markets have seized up. This pessimistic view argues that losses from the subprime arena are the tip of the iceberg. An economic downturn, combined with a weakened financial system, will result in a perfect storm for the multi-trillion dollar derivatives market. It is feared that cascading problems with inter-connected counterparty risk, swaps and excessive leverage will cause the entire “house of cards,” otherwise known as the U.S. financial system, to collapse. At a minimum, they fear credit will contract, causing a major economic slowdown.
For many, this catastrophic outlook brings back memories of the Great Depression, when bank failures begot more bank failures, money was scarce, credit was impossible to obtain, and economic problems spread like wildfire.
This outlook is both perplexing and worrisome. Perplexing, because it is hard to see how a campfire of a problem can spread to burn down the entire forest. What Federal Reserve Chairman Ben Bernanke recently estimated as a $100 billion loss on subprime loans would represent only 0.1% of the $100 trillion in combined assets of all U.S. households and U.S. non-farm, non-financial corporations. Even if losses ballooned to $300 billion, it would represent less than 0.3% of total U.S. assets.
Beneath every dollar of counterparty risk, and every swap, derivative, or leveraged loan, is a real economic asset. The only way credit troubles could spread to take down the entire system is if the economy completely fell apart. And that only happens when government policy goes wildly off track.
In the Great Depression, the Federal Reserve allowed the money supply to collapse by 25%, which caused a dangerous deflation. In turn, this deflation caused massive bank failures. The Smoot-Hawley Tariff Act of 1930, Herbert Hoover’s tax hike passed in 1932, and then FDR’s alphabet soup of new agencies, regulations and anticapitalist government activity provided the coup de grace. No wonder thousands of banks failed and unemployment ballooned to 20%.
But in the U.S. today, the Federal Reserve is extremely accommodative. Not only is the federal funds rate well below the trend in nominal GDP growth, but real interest rates are low and getting lower. In addition, gold prices have almost quadrupled during the past six years, while the consumer price index rose more than 4% last year.
These monetary conditions are not conducive to a collapse of credit markets and financial institutions. Any financial institution that goes under does so because of its own mistakes, not because money was too tight. Trade protectionism has not become a reality, and while tax hikes have been proposed, Congress has been unable to push one through.
Which brings up an interesting thought: If the U.S. financial system is really as fragile as many people say, why should we go to such lengths to save it? If a $100 billion, or even $300 billion, loss in the subprime loan world can cause the entire system to collapse, maybe we should be working hard to build a better system that is stronger and more reliable.
Pumping massive amounts of liquidity into the economy and pumping up government spending by giving money away through rebates may create more problems than it helps to solve. Kicking the can down the road is not a positive policy.
The irony is almost too much to take. Yesterday everyone was worried about excessive consumer spending, a lack of saving, exploding debt levels, and federal budget deficits. Today, our government is doing just about everything in its power to help consumers borrow more at low rates, while it is running up the budget deficit to get people to spend more. This is the tyranny of the urgent in an election year and it’s the development that investors should really worry about. It reads just like the 1970s.
The good news is that the U.S. financial system is not as fragile as many pundits suggest. Nor is the economy showing anything other than normal signs of stress. Assuming a 1.5% annualized growth rate in the fourth quarter, real GDP will have grown by 2.8% in the year ending in December 2007 and 3.2% in the second half during the height of the so-called credit crunch. Initial unemployment claims, a very consistent canary in the coal mine for recessions, are nowhere near a level of concern.
Because all debt rests on a foundation of real economic activity, and the real economy is still resilient, the current red alert about a crashing house of cards looks like another false alarm. Warren Buffett, Wilbur Ross and Bank of America are buying, and there is
still $1.1 trillion in corporate cash on the books. The bench of potential buyers on the sidelines is deep and strong. Dow 15,000 looks much more likely than Dow 10,000. Keep the faith and stay invested. It’s a wonderful buying opportunity.
Mr. Wesbury is chief economist for First Trust Portfolios, L.P.
♥

